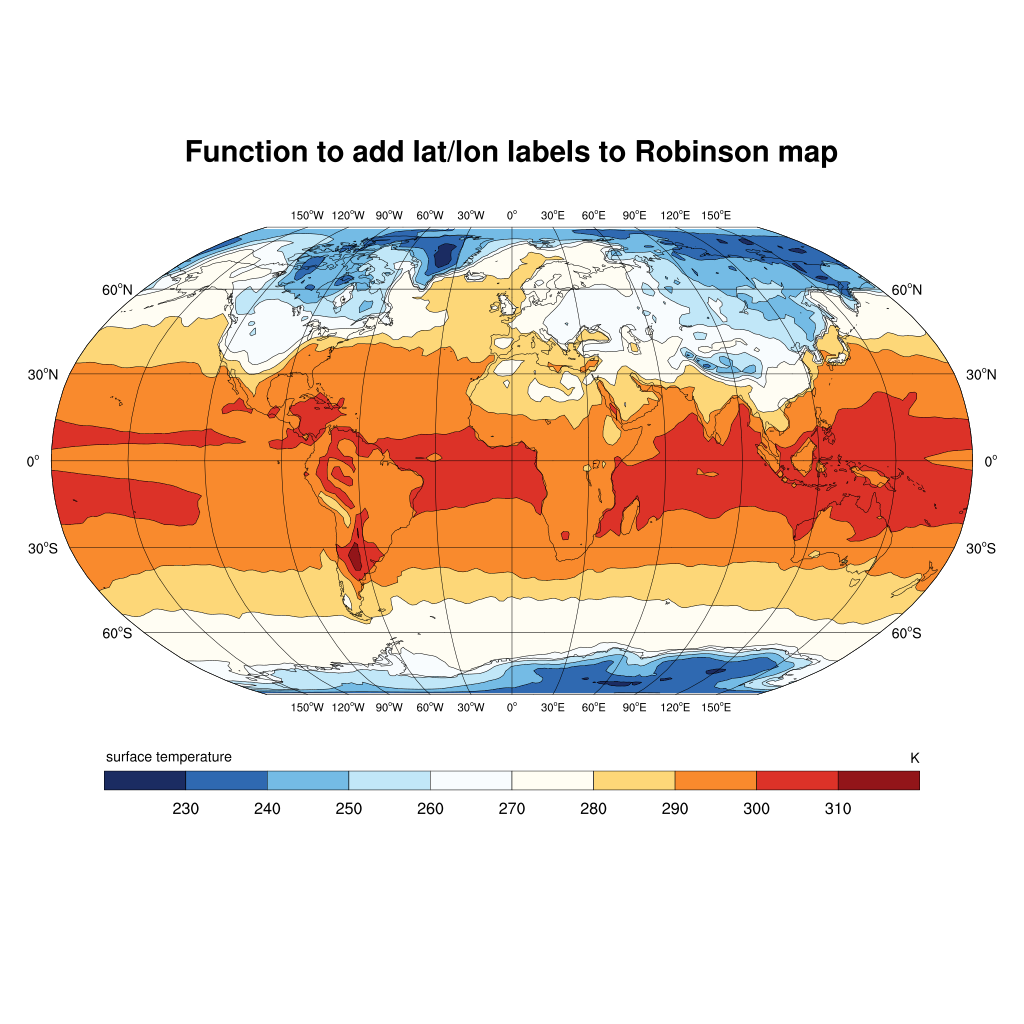
DKRZ NCL add latitude/longitude annotation to Robinson projection example#
Example script:
;----------------------------------------------------------------------
;-- DKRZ NCL example:  NCL_add_latlon_labels_to_robinson_projection.ncl
;--
;-- Description:  retrieve the NDC coordinates of the longitude/latitude
;--               labels from plot
;--                 - datatondc
;--                 - gsn_text_ndc
;--                 - font function codes
;--
;-- 14.03.16  kmf
;----------------------------------------------------------------------
;----------------------------------------------------------------------
; This function attaches lat/lon labels to a Robinson plot.
;
; You will likely need to change lat_values and/or lon_values to
; contain the locations where you want lat/lon labels.
;----------------------------------------------------------------------
function add_robinson_labels(wks,map,latspc,lonspc)
local lat_values, lon_values, lat_labels, lon_labels, \
      nlat, nlon, txres, x_in, y_in, x_out, y_out
begin
  minlat =  -90
  maxlat =   90
  minlon = -180
  maxlon =  180

;-- pick some "nice" values for the latitude labels
  lat_values = ispan(minlat,maxlat,latspc) * 1.
  lon_values = ispan(minlon,maxlon,lonspc) * 1.
  nlat       = dimsizes(lat_values)
  nlon       = dimsizes(lon_values)

;-- create the labels; add space before right labels, and after left labels
  lat_labels = where(lat_values.lt.0,abs(lat_values)+"~S~o~N~S",lat_values+"~S~o~N~N")
  lat_labels = where(lat_values.eq.0,"0~S~o~N~",lat_labels)
  lat_labels = where(abs(lat_values).eq.90,"",lat_labels) ;-- no label at lat=abs(90)

;---------------------
;-- latitude labels
;---------------------
  txres                  =  True     ;-- set text resources
  txres@txFontHeightF    =  0.010
  txres@txFontThicknessF =  2

  y_in  = lat_values                         ;-- plot coordinates
  x_in  = new(dimsizes(y_in),float)          ;-- plot coordinates
  x_out = new(dimsizes(x_in),float)          ;-- for NDC coordinates
  y_out = new(dimsizes(y_in),float)          ;-- for NDC coordinates

;-- left latitude labels
  txres@txJust = "CenterRight"
  x_in = -180.0
  datatondc(map,x_in,y_in,x_out,y_out)
  gsn_text_ndc(wks, lat_labels, x_out-0.012, y_out, txres)

;-- right latitude labels
  txres@txJust = "CenterLeft"
  x_in = 180.0
  datatondc(map,x_in,y_in,x_out,y_out)
  gsn_text_ndc(wks, lat_labels, x_out+0.012, y_out, txres)

;---------------------
;-- longitude labels
;---------------------
  lon_labels = where(lon_values.lt.0,abs(lon_values)+"~S~o~N~W",lon_values+"~S~o~N~E")
  lon_labels = where(lon_values.eq.0,"0~S~o~N~",lon_labels)
  lon_labels = where(abs(lon_values).eq.180,"",lon_labels) ;-- no label at lon=abs(180)

;-- longitude labels
  txres@txJust           = "CenterCenter"
  txres@txFontHeightF    =  0.008
  txres@txFontThicknessF =  2

  x_in  := lon_values
  y_in  := new(dimsizes(x_in),float)
  x_out := new(dimsizes(x_in),float)
  y_out := new(dimsizes(y_in),float)

;-- add top longitude labels
  y_in = 90.0
  datatondc(map,x_in,y_in,x_out,y_out)
  gsn_text_ndc(wks, lon_labels, x_out, y_out+0.012, txres)

;-- add bottom longitude labels
  y_in = -90.0
  datatondc(map,x_in,y_in,x_out,y_out)
  gsn_text_ndc(wks, lon_labels, x_out, y_out-0.012, txres)

;-- that's it
  return(map)

end   ;-- end function add_robinson_labels

;------------
; MAIN
;------------
begin

;-- set data directory and file name
  diri = "$HOME/NCL/general/data/new_data/"
  fili = "rectilinear_grid_2D.nc"

;-- open file and read variable
  f    =  addfile(diri+fili, "r")
  var  =  f->tsurf(0,:,:)

;-- define workstation
  wks_type          = "png"
  wks_type@wkWidth  =  1024
  wks_type@wkHeight =  1024
  wks  = gsn_open_wks(wks_type, "plot_add_labels_to_Robinson_projection")

  dlon = 30
  dlat = 30

;-- set resources
  res                       =  True
  res@gsnDraw               =  False
  res@gsnFrame              =  False
  res@gsnLeftString         = ""
  res@gsnRightString        = ""

  res@vpWidthF              =  0.9
  res@vpHeightF             =  0.8
  res@vpXF                  =  0.05
  res@vpYF                  =  0.95

  res@cnFillOn              =  True
  res@cnLineLabelsOn        =  False

  res@mpProjection          = "Robinson"
  res@mpPerimOn             =  False
  res@mpGridAndLimbOn       =  True
  res@mpGridLatSpacingF     =  dlat
  res@mpGridLonSpacingF     =  dlon

  res@lbBoxMinorExtentF     =  0.15                   ;-- decrease height of labelbar

  res@tiMainString          = "Function to add lat/lon labels to Robinson map"
  res@tiMainOffsetYF        =  0.04                   ;-- move title upward

  plot = gsn_csm_contour_map(wks,var,res)

;-- add variable long_name and units between labelbar and plot
  stres                =  True
  stres@txFontHeightF  =  0.010
  gsn_text_ndc(wks, var@long_name, 0.165, 0.26, stres)
  gsn_text_ndc(wks, var@units,     0.894, 0.26, stres)

;-- attach latitude labels
  map  = add_robinson_labels(wks,plot,dlat,dlon)

;-- drawing the plot with attached labels
  draw(plot)
  frame(wks)

end
Result: