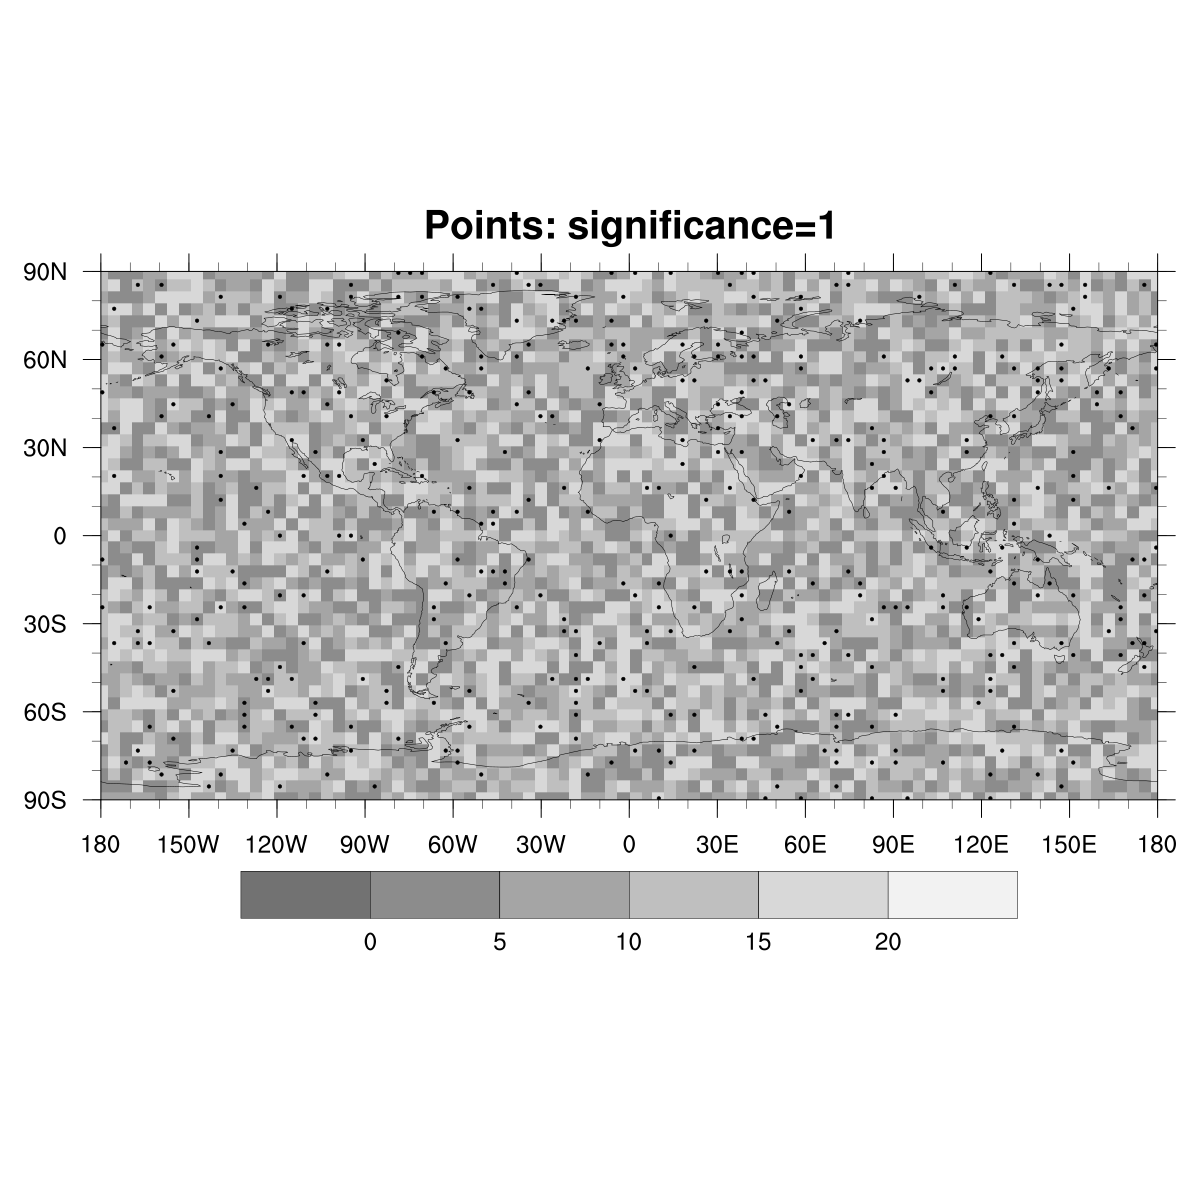
DKRZ NCL add significance points (sig = 1) to contour plot#
Example script:
;--------------------------------------------------------------------
; DKRZ NCL Example:    significance_points_per_grid_cell.ncl
;
; Description:         - draw contour plot
;                      - add dots on grid cells when significance = 1
;                      - use dummy data
;                      - use colormap GMT_gray
; 16.07.18  kmf
;--------------------------------------------------------------------
begin
;-- generate lat and lon arrays with named dimensions
  nlat      =  45
  nlon      =  90
  lat       =  fspan( -89.5, 89.5,nlat)
  lon       =  fspan(-179.5,179.5,nlon)
  lat@units = "degrees_north"
  lon@units = "degrees_east"

;-- generate dummy data with named dimensions
  data     = random_uniform(0,20,(/nlat,nlon/))
  data!0   = "lat"
  data!1   = "lon"
  data&lat =  lat
  data&lon =  lon

;-- generate dummy significance data (0/1)
  sig  = random_uniform(0,1,(/nlat,nlon/))
  sig!0   = "lat"
  sig!1   = "lon"
  sig&lat =  lat
  sig&lon =  lon
  sig     = where(sig .gt. 0.9, 1,0)

;-- colormap; we want to use only the brighter grays
  cmap  = read_colormap_file("GMT_gray")
  cmap := cmap(4::,:)

;-- open workstation
  wks_type          = "png"
  wks_type@wkWidth  = 1200
  wks_type@wkHeight = 1200
  wks = gsn_open_wks(wks_type,"plot_significance_ppgc")

;-- contour plot resources
  res                      =  True
  res@gsnDraw              =  False
  res@gsnFrame             =  False
  res@gsnMaximize          =  True

  res@cnFillMode           = "RasterFill"
  res@cnFillOn             =  True
  res@cnLinesOn            =  False
  res@cnInfoLabelOn        =  False
  res@cnFillPalette        =  cmap
  res@cnLevelSelectionMode = "ManualLevels"
  res@cnMinLevelValF       =   0.
  res@cnMaxLevelValF       =  20.
  res@cnLevelSpacingF      =   5.

;-- draw the contour plot of variable data
  plot = gsn_csm_contour_map(wks,data,res)
;  draw(plot)

;-- retrieve the indices of significance (sig = 1)
  sig1d    = ndtooned(sig)
  get_nsig = dimsizes(ind(sig1d .eq. 1))
  indices  = ind_resolve(ind(sig1d .eq.1),dimsizes(sig))

;-- polymarker resources
  plmres                    =  True
  plmres@gsMarkerSizeF      =  0.003            ;-- marker size (default: 0.007)
  plmres@gsMarkerIndex      =  16               ;-- filled dots

;-- draw the polymarker
  do i=0,get_nsig-1
     str = unique_string("plmark")
     plot@$str$ = gsn_add_polymarker(wks,plot,lon(indices(i,1)),lat(indices(i,0)),plmres)
  end do

;-- draw the plot and advance the frame
  draw(plot)
  frame(wks)

end
Result: