DKRZ NCL add text to plot example#
Example script:
;----------------------------------------------------------------------
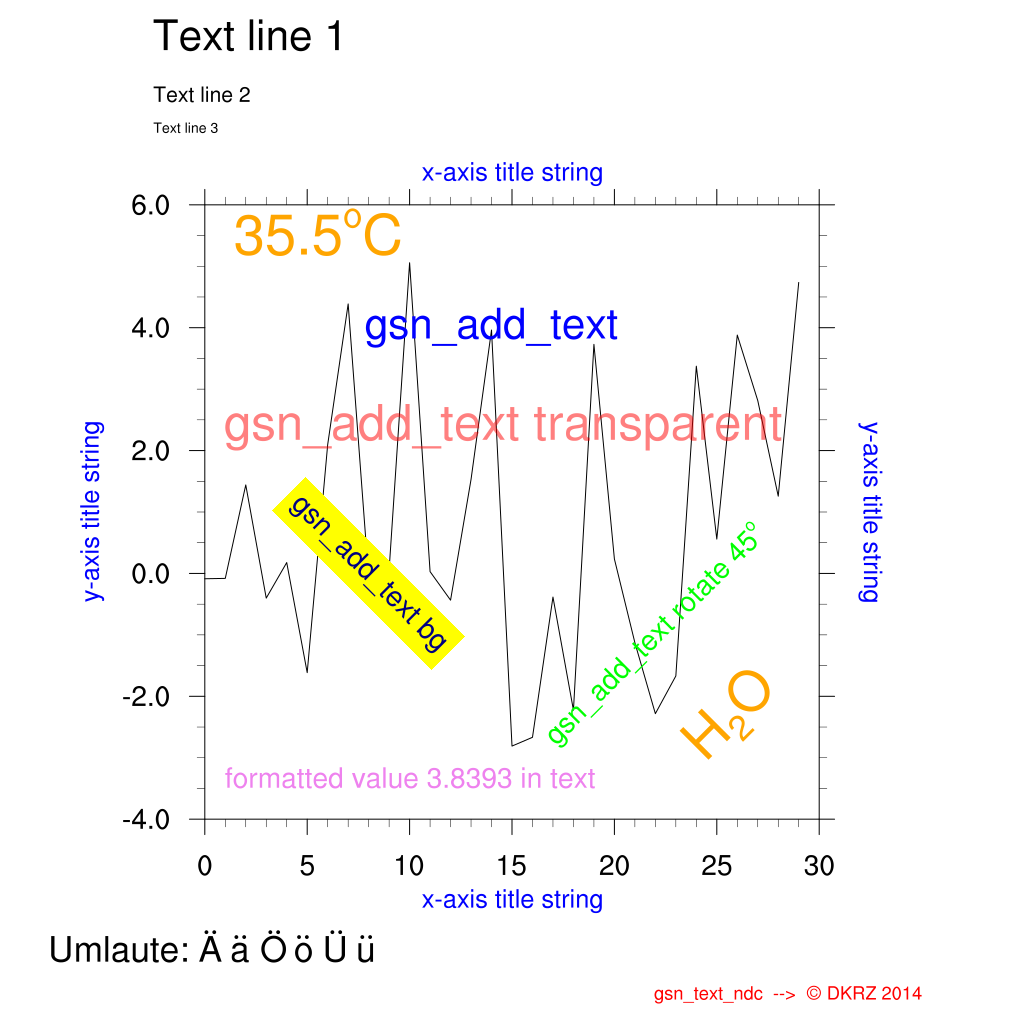
;-- DKRZ NCL example: NCL_additional_text.ncl
;--
;-- Description: show text capability
;-- - subscript, superscript
;-- - German Umlaute
;-- - text background
;-- - using map and NDC coordinates
;--
;-- 25.06.14 kmf
;----------------------------------------------------------------------
begin
;-- generate dummy data
x = ispan(0,29,1)
y = random_uniform(-3,6,30)
;-- open a workstation
wks_type = "png"
wks_type@wkWidth = 1024
wks_type@wkHeight = 1024
wks = gsn_open_wks(wks_type, "plot_add_text") ;-- open a workstation
;-- set plot resources
res = True
res@gsnDraw = False ;-- don't draw plot yet
res@gsnFrame = False ;-- don't advance frame
res@xyLineThicknessF = 2.0 ;-- increase the line width
plot = gsn_csm_xy(wks, x, y, res) ;-- create the default xy-plot
;-- additional text on plot using plot coordinate
txres = True ;-- text resources additional text
txres@txFontColor = "blue" ;-- change to white
txres@txFontHeightF = 0.03 ;-- decrease font size
txres@txJust = "CenterCenter" ;-- text justification
id = gsn_add_text(wks, plot, "gsn_add_text", 14, 4, txres) ;-- center position x=14, y=4
txres@txFontColor = "green" ;-- change to white
txres@txFontHeightF = 0.02 ;-- decrease font size
txres@txAngleF = 45 ;-- rotate text counterclockwise 45 deg.
id = gsn_add_text(wks, plot, "gsn_add_text rotate 45~S~o~N~", 22, -1, txres) ;-- center position x=22, y=-1
txres@txFontColor = "navy" ;-- change to white
txres@txFontHeightF = 0.02 ;-- decrease font size
txres@txAngleF = -45 ;-- rotate text counterclockwise 45 deg.
txres@txBackgroundFillColor = "yellow" ;-- text backround color
id = gsn_add_text(wks, plot, "gsn_add_text bg", 8, 0, txres) ;-- center position x=8, y=0
txres@txFontColor = "red" ;-- change to white
txres@txFontHeightF = 0.035 ;-- decrease font size
txres@txFontOpacityF = 0.5 ;-- set transparency of text
txres@txJust = "BottomLeft" ;-- text justification
txres@txBackgroundFillColor = -1 ;-- set text background color to fully transparent
delete(txres@txAngleF) ;-- reset text rotation
id = gsn_add_text(wks, plot, "gsn_add_text transparent", 1, 2, txres) ;-- center position x=1, y=2
value = 3.83927489235
str = "formatted value "+sprintf("%3.4f", value)+" in text"
txres@txFontColor = "violet" ;-- change to white
txres@txFontOpacityF = 1.0 ;-- set fully opacity of text
txres@txFontHeightF = 0.02 ;-- decrease font size
id = gsn_add_text(wks, plot, str, 1, -3.5, txres)
;-- additional text using page coordinate (NDC)
line1 = "Text line 1"
line2 = "Text line 2"
line3 = "Text line 3"
;-- text strings on left top of the plot
ndcres = True ;-- text resources copyright string
ndcres@txFontHeightF = 0.03 ;-- decrease font size
ndcres@txJust = "BottomLeft" ;-- text justification
gsn_text_ndc(wks, line1, 0.15, 0.95, ndcres)
ndcres@txFontHeightF = 0.015 ;-- decrease font size
gsn_text_ndc(wks, line2, 0.15, 0.90, ndcres)
ndcres@txFontHeightF = 0.01 ;-- decrease font size
gsn_text_ndc(wks, line3, 0.15, 0.87, ndcres)
;-- user defined axis title strings
ndcres@txFontHeightF = 0.018 ;-- decrease font size
ndcres@txFontColor = "blue" ;-- change to white
ndcres@txAngleF = 90 ;-- rotate text counterclockwise 90 deg.
ndcres@txJust = "CenterCenter" ;-- text justification
gsn_text_ndc(wks, "y-axis title string", 0.09, 0.5, ndcres)
ndcres@txAngleF = -90 ;-- rotate text clockwise 90 deg.
gsn_text_ndc(wks, "y-axis title string", 0.85, 0.5, ndcres)
ndcres@txAngleF = 0 ;-- unrotate text
gsn_text_ndc(wks, "x-axis title string", 0.5, 0.12, ndcres)
gsn_text_ndc(wks, "x-axis title string", 0.5, 0.83, ndcres)
;-- super script
super = "35.5~S~o~N~C"
sub = "H~B~2~N~O"
ndcres@txFontHeightF = 0.04 ;-- make font size smaller
ndcres@txFontColor = "orange" ;-- change to white
ndcres@txJust = "BottomLeft" ;-- text justification
gsn_text_ndc(wks, super, 0.23, 0.75, ndcres)
ndcres@txAngleF = 45 ;-- rotate text counterclockwise 45 deg.
gsn_text_ndc(wks, sub, 0.7, 0.25, ndcres)
delete(ndcres@txAngleF)
;-- Umlaute
Auml = "A~H-15V6F35~H~FV-6H3~"
auml = "a~H-13V2F35~H~FV-2H3~"
Ouml = "O~H-16V6F35~H~FV-6H3~"
ouml = "o~H-14V2F35~H~FV-2H3~"
Uuml = "U~H-15V6F35~H~FV-6H3~"
uuml = "u~H-13V2F35~H~FV-2H3~"
ndcres@txFontColor = "black" ;-- change to white
ndcres@txFontHeightF = 0.025 ;-- make font size smaller
gsn_text_ndc(wks,"Umlaute: "+Auml+" "+auml+" "+Ouml+" "+ouml+" "+Uuml+" "+uuml,0.05,0.06,ndcres)
;-- copyright
ndcres@txFontColor = "red" ;-- change to white
ndcres@txFontHeightF = 0.013 ;-- make font size smaller
ndcres@txJust = "BottomRight" ;-- text justification
gsn_text_ndc(wks,"gsn_text_ndc --> ~F35~c ~F21~~N~DKRZ 2014", 0.9, 0.02, ndcres)
;-- plot copyright info
;-- draw the plot
draw(plot)
frame(wks)
end
Result: