DKRZ NCL attach plot to another plot along the y-axis example#
Example script:
;-----------------------------------------------------------------
;-- DKRZ NCL example: NCL_attach_plot_along_y.ncl
;--
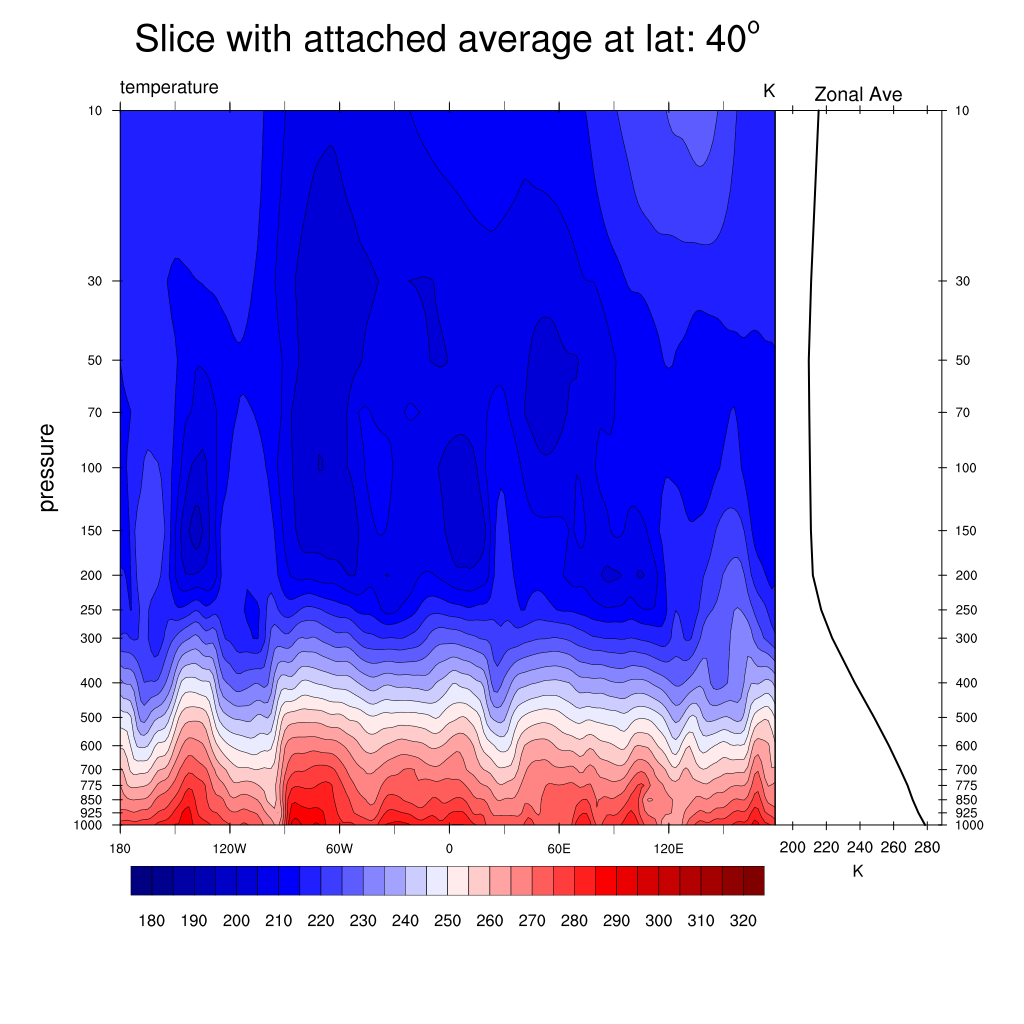
;-- Description: - create slice plot
;-- - attach xy-plot to right y-axis
;--
;-- 19.03.15 kmf
;-----------------------------------------------------------------
begin
diri = "$HOME/NCL/NCL_User_Guide/data/"
fili = "rectilinear_grid_3D.nc"
f = addfile(diri+fili,"r")
var = f->t(0,:,{40},:)
x = dim_avg_Wrap(var)
y = f->lev/100
labels = y+""
;-- open workstation
wks_type = "png" ;-- plot output type
wks_type@wkWidth = 1024
wks_type@wkHeight = 1024
wks = gsn_open_wks (wks_type, "plot_attach_plot_along_y" )
;-- resources pressure height plot
res = True ;-- plot mods desired
res@gsnDraw = False ;-- don't draw yet
res@gsnFrame = False ;-- don't advance frame yet
res@cnFillOn = True ;-- turn on color fill
res@cnFillPalette = "BlWhRe" ;-- choose color map
res@cnLevelSelectionMode = "ManualLevels" ;-- manual contour levels
res@cnMinLevelValF = 180. ;-- minimum level
res@cnMaxLevelValF = 320. ;-- maximum level
res@cnLevelSpacingF = 5. ;-- contour spacing
res@tiMainString = "Slice with attached average at lat: 40~S~o~N~"
res@tiYAxisFontHeightF = 0.014
res@trYReverse = True ;-- reverese y-axis
res@vpWidthF = 0.55 ;-- set width
res@vpHeightF = 0.60 ;-- set height
res@vpXF = 0.135 ;-- set x-pos
res@vpYF = 0.8 ;-- set y-pos
res@tmYLMode = "Explicit"
res@tmYLValues = y
res@tmYLLabels = labels
res@tmYROn = False
res@tmYLMinorOn = False
res@tmYRLabelFontHeightF = 0.010
res@tmYLLabelFontHeightF = 0.010
res@tmYLMajorLengthF = 0.008 ;-- change the tickmark length
res@tmXBLabelFontHeightF = 0.0012
res@tmXBMajorLengthF = 0.008 ;-- change the tickmark length
res@gsnPresHgtHeightLabelOn = False
res@lbBoxMinorExtentF = 0.2 ;-- decrease height of labelbar boxes
res@lbLabelFontHeightF = 0.010
res@lbBoxMinorExtentF = 0.15 ;-- decrease the height of the labelbar
res@pmLabelBarOrthogonalPosF = -0.09 ;-- position label bar
plot_slice = gsn_csm_pres_hgt(wks, var, res)
;-- create xy-plot
getvalues plot_slice
"vpXF" : vpx
"vpYF" : vpy
"vpWidthF" : vpw
"vpHeightF" : vph
end getvalues
;-- resources xy-plot
xyres = True
xyres@gsnDraw = False ;-- don't draw yet
xyres@gsnFrame = False ;-- don't advance frame yet
xyres@vpWidthF = 0.14 ;-- set width
xyres@vpHeightF = vph ;-- set height
xyres@vpXF = vpx+vpw+0.02 ;-- set x-pos
xyres@vpYF = vpy ;-- set y-position
xyres@tmYUseLeft = False
xyres@tmYLMode = "Explicit"
xyres@tmYLValues = y
xyres@tmYLMinorOn = False ;-- no minor tick marks
xyres@tmYRLabelsOn = True
xyres@tmYRMode = "Explicit"
xyres@tmYRValues = y
xyres@tmYRLabels = labels
xyres@tmYROn = True
xyres@tmYRBorderOn = True
xyres@tmYRLabelFontHeightF = 0.008
xyres@tmYLLabelFontHeightF = 0.010
xyres@tmYLMajorLengthF = 0.008 ;-- change the tickmark length
xyres@tmXTOn = True
xyres@tmXBOn = True
xyres@tmXBMinorOn = False ;-- no minor tickmarks
xyres@tmXBLabelFontHeightF = 0.0010
xyres@tmXBMajorLengthF = 0.008 ;-- change the tickmark length
xyres@tiXAxisFontHeightF = 0.012
xyres@tiXAxisString = "K"
xyres@gsnCenterString = "Zonal Ave" ;-- add title
xyres@xyYStyle = "Log"
xyres@xyLineThicknessF = 4 ;-- line thickness
xyres@trYMinF = min(y)
xyres@trYMaxF = max(y)
xyres@trYLog = True
xyres@trYReverse = True ;-- reverese y-axis
xyres@trXMinF = min(x)-20
xyres@trXMaxF = max(x)+10
plot_xy = gsn_csm_xy(wks, x, y, xyres)
;-- attach plot
newplot = gsn_attach_plots(plot_slice,(/plot_xy/),res,xyres)
draw(plot_slice) ;-- draw the plot
frame(wks) ;-- advance the frame
end
Result: