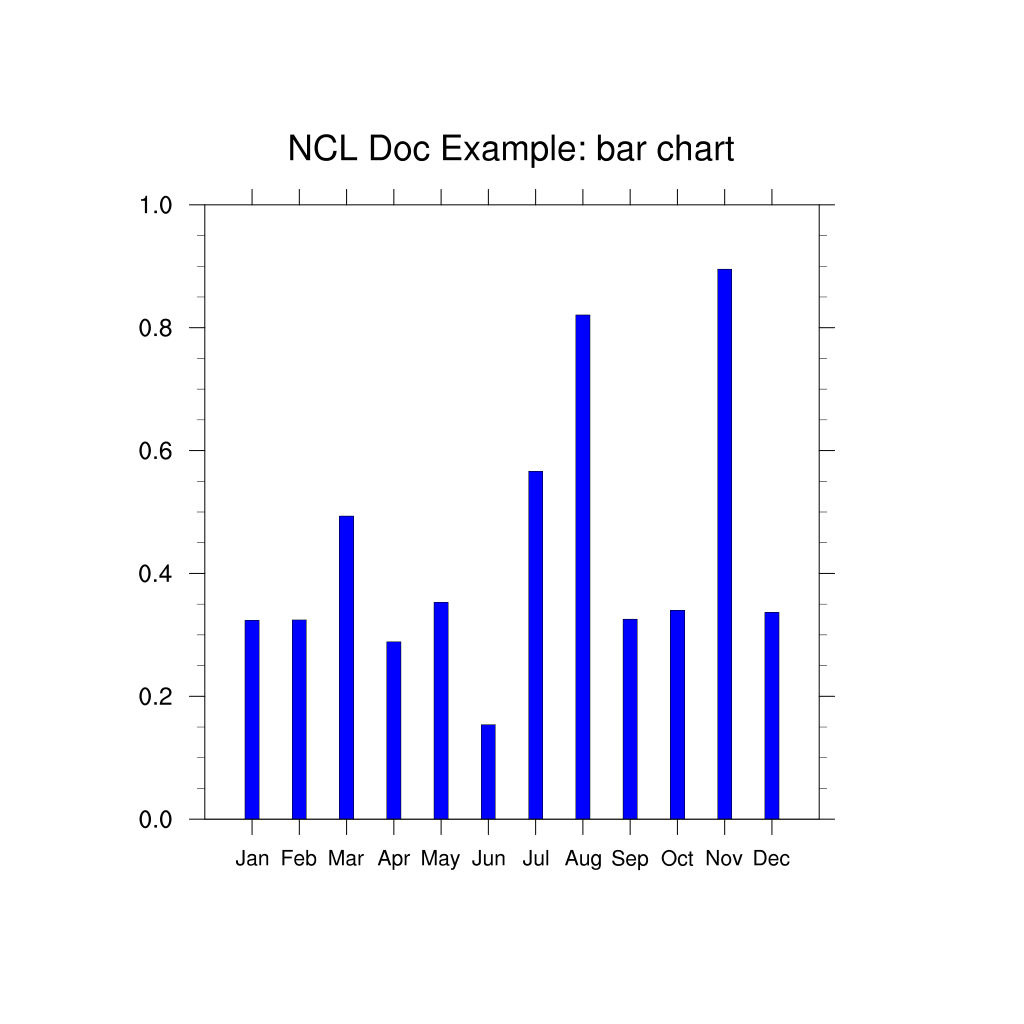
DKRZ NCL bar chart example#
DKRZ NCL example script:
;-----------------------------------------------------------------
;  DKRZ NCL Example:   NCL_bar_chart.ncl
;
;  30.10.14 kmf
;-----------------------------------------------------------------
begin

   low  =  0.0
   high =  1.0

   n = 12

   x = fspan(1.0, 12.0, n)
   y = random_uniform(low, high, n)

;-- open a workstation
   wks = gsn_open_wks("png","plot_bar_chart")

;-- set resources
   res                       =  True
   res@gsnXYBarChart         =  True             ;-- use bar chart style
   res@gsnXYBarChartBarWidth =  0.3              ;-- width of bars
   res@gsnXYBarChartColors   = "blue"            ;-- color

   res@trXMinF               =  0.0              ;-- x-axis min value
   res@trXMaxF               = 13.0              ;-- x-axis max value
   res@trYMinF               =  0.0              ;-- y-axis min value
   res@trYMaxF               =  1.0              ;-- y-axis max value

   res@tmXBMode              = "Explicit"        ;-- explicit labels
   res@tmXBValues            =  ispan(1,12,1)    ;-- bottom x-axis tickmark values
   res@tmXBLabels            = (/"Jan","Feb","Mar","Apr","May","Jun","Jul","Aug","Sep", \
                                 "Oct","Nov","Dec"/) ;-- x-axis labels
   res@tmXBLabelFontHeightF  =  0.015            ;-- x-axis font size

   res@tiMainString          = "NCL Doc Example: bar chart"  ;-- title string

;-- create the plot
   plots = gsn_csm_xy(wks, x, y, res)

end
Result: