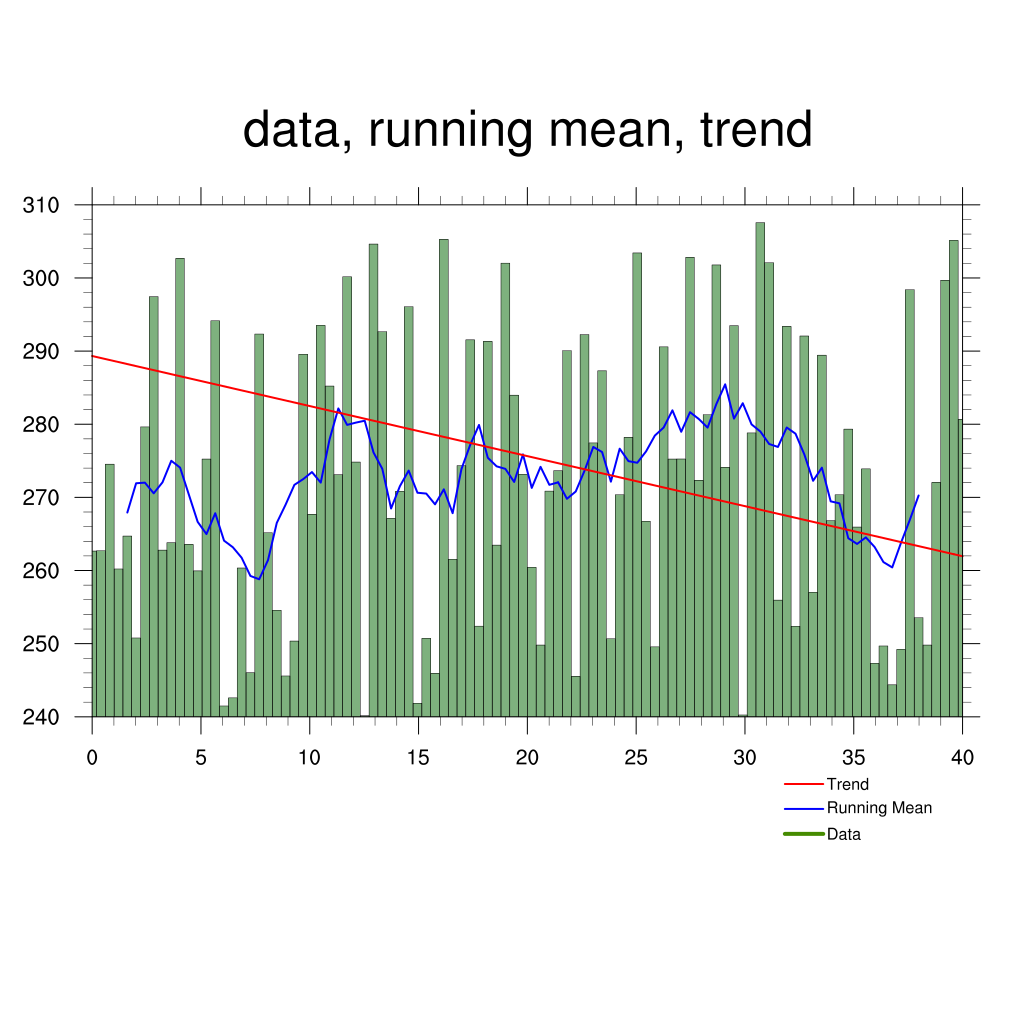
DKRZ NCL bar chart plot with some statistics#
DKRZ NCL script:
;-----------------------------------------------------------------
;   DKRZ NCL Example:     NCL_bar_chart_avg.ncl
;
;   02.07.2015 kmf
;-----------------------------------------------------------------
;-----------------------------------------------------------------
;-- Function:   calc_stat_trend(...)
;--                               ->   calculate the trend
;-----------------------------------------------------------------
undef("calc_stat_trend")
function calc_stat_trend(x,var)
local DEBUG,npts,a,b,c,tsum,tysum,tyval,tsqsum,tsqval,summe,val,ytquer,ttquer
begin
   DEBUG = True
   npts  = dimsizes(x)
   c = var
   tsum   = 0.
   tysum  = 0.
   tyval  = 0.
   tsqsum = 0.
   tsqval = 0.
   summe  = 0.
   val    = 0.

   do i=0,npts-1
         val    = var(i)
         summe  = summe+val
         tsum   = i+tsum
         tyval  = i*val
         tysum  = tyval+tysum
         tsqval = i*i
         tsqsum = tsqval+tsqsum
   end do

   ytquer = summe/(npts-1)
   ttquer = tsum/(npts-1)

   b = (tysum-(npts*ttquer*ytquer))/(tsqsum-(npts*ttquer*ttquer))
   a = (ytquer)-(b*(ttquer))

   if (DEBUG) then
         print("")
         print("+++++ trend: t2 =  "+ npts)
         print("+++++ trend: summe   = sum of values   = "+ summe)
         print("+++++ trend: ytquer = summe/t2         = "+ ytquer)
         print("+++++ trend: tsum     = sum of t       = "+ tsum)
         print("+++++ trend: tquer   = tsum/t2         = "+ tsum/npts)
         print("+++++ trend: tysum   = sum of t*values = "+ tysum)
         print("+++++ trend: tsqsum = sum of t*t       = "+ tsqsum)
         print("")
         print("+++++ trend: linear regression equation:  y = "+a+" + "+b+" * t")
         print("")
   end if

   do i = 0,npts-1
         c(i)=a+(b*i)
   end do

   return(c)
end

;-------------------------------------------------------
;-- MAIN
;-------------------------------------------------------
begin
     low  =   240.0
     high =   310.0
     xmin =     0.0
     xmax =    40.0
     n    =   100

     x =   fspan(xmin, xmax, n)                                ;-- x data array
     y =   random_uniform(low, high, n)                        ;-- random data
     y_rave  =   runave_n_Wrap(y,10,0,0)                       ;-- smoothed running mean
     y_trend =   calc_stat_trend(x,y)                          ;-- trend

     data =   (/y_rave,y_trend/)

     labels  =   (/" Running Mean"," Trend"/)                  ;-- line labels
     colors  =   (/"blue","red"/)                              ;-- line colors
     pattern =   (/0,   0/)                                    ;-- line pattern
     size    =   (/4.0,4.0/)                                   ;-- line thickness

;-- open a workstation
     wks_type = "png"
     wks_type@wkWidth    =   1024
     wks_type@wkHeight   =   1024
     wks = gsn_open_wks(wks_type,"plot_bar_chart_avg")

;-- set resources
     res                           =   True
     res@gsnDraw                   =   False                   ;-- don't draw plot yet
     res@gsnFrame                  =   False                   ;-- don't advance frame
     res@gsnXYBarChart             =   True                    ;-- use bar chart style
     res@gsnXYBarChartColors       = "darkgreen"               ;-- color
     res@gsnXYBarChartFillOpacityF =   0.3                     ;-- opacity

     res@vpWidthF                  =   0.85                    ;-- viewport width
     res@vpHeightF                 =   0.5                     ;-- viewport height
     res@vpXF                      =   0.09                    ;-- viewport x-position
     res@vpYF                      =   0.8                     ;-- viewport y-position

     res@trXMinF                   =   xmin                    ;-- x-axis min value
     res@trXMaxF                   =   xmax                    ;-- x-axis max value
     res@trYMinF                   =   low                     ;-- y-axis min value
     res@trYMaxF                   =   high                    ;-- y-axis max value

     res@tmXBMode                  = "Manual"
     res@tmXBTickSpacingF          =   5.0                     ;-- label every 5th tickmark
     res@tmXBMinorPerMajor         =   4                       ;-- minor tickmarks
     res@tmXBLabelFontHeightF      =   0.015                   ;-- x-axis font size

     res@tiMainString              = "data, running mean, trend"  ;-- title string

;-- bar chart plot
     bars = gsn_csm_xy(wks, x, y, res)

;-- line plot resources
     delete([/res@gsnXYBarChart,res@gsnXYBarChartColors,res@gsnXYBarChartFillOpacityF/])
     resa                          =   res                     ;-- line plot resources
     resa@xyLineColors             =   colors                  ;-- set line colors
     resa@xyMarkLineModes          = "Lines"                   ;-- line modus
     resa@xyDashPatterns           =   pattern                 ;-- set line pattern (0: solid line)
     resa@xyLineThicknesses        =   size                    ;-- set line thickness (2: thicker)

;-- line plot
     lines = gsn_csm_xy(wks, x, data, resa)

;-- overlay line plot on bar chart plot
     overlay(bars,lines)

;-- create a legend
     nitems   =   3                                            ;-- bars and two lines with labels
     labels   :=   (/" Data"," Running Mean"," Trend"/)        ;-- line labels
     colors   :=   (/"chartreuse4","blue","red"/)              ;-- line colors
     pattern  :=   (/0, 0,   0/)                               ;-- line pattern
     size     :=   (/8.0,4.0,4.0/)                             ;-- line thickness

     lgres  =  True
     lgres@lgLineColors        =   colors
     lgres@lgMonoLineThickness =   False                       ;-- different line thicknesses
     lgres@lgLineThicknesses   =   size                        ;-- legend line thickness = contour line thickness
     lgres@lgDashIndexes       =   pattern                     ;-- sets dash pattern
     lgres@lgItemType          = "Lines"                       ;-- show lines only (default)
     lgres@lgLabelFontHeightF  =   0.10                        ;-- set the legend label font thickness
     lgres@vpWidthF            =   0.15                        ;-- width of legend (NDC)
     lgres@vpHeightF           =   0.08                        ;-- height of legend (NDC)
     lgres@lgPerimOn           =   False                       ;-- don't draw the line around legend

     lbid = gsn_create_legend(wks,nitems,labels,lgres)         ;-- create legend

     amres  =   True
     amres@amParallelPosF      =   0.38                        ;-- move legend to the right
     amres@amOrthogonalPosF    =   0.68                        ;-- move the legend down
     annoid1 = gsn_add_annotation(bars,lbid,amres)             ;-- add legend to plot

;-- draw the plot
     draw(bars)
     frame(wks)

end
Result: