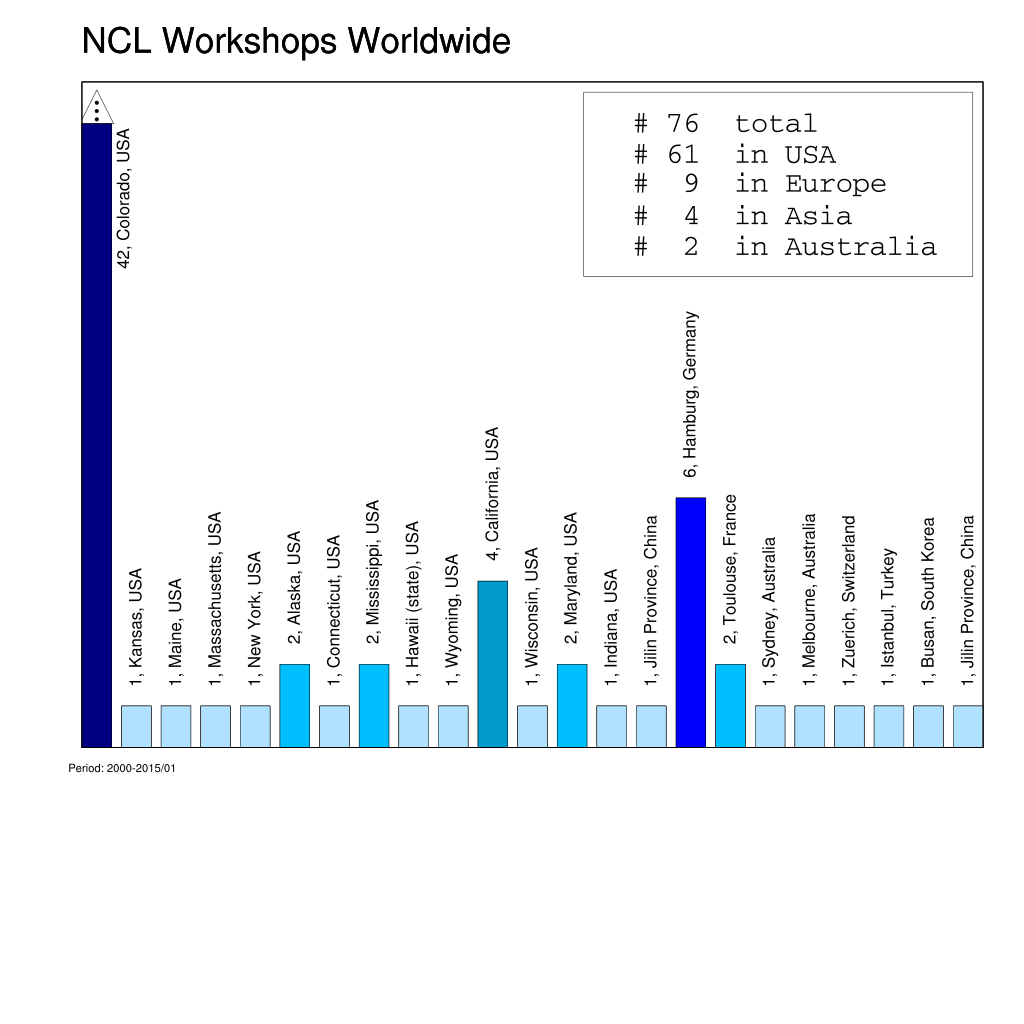
DKRZ NCL bar chart plot with text example#
DKRZ NCL script:
;-----------------------------------------------------------------
; DKRZ NCL Example:
;
; Description:    read CSV data NCL_Workshops_worldwide.csv
;                 bar chart plot with text
; 16.01.15  kmf
;-----------------------------------------------------------------
begin
;-- input file name and read data
  fname  = "NCL_Workshops_ww_sampled_states.csv"
  data   =  asciiread(fname, -1, "string")

;-- used delimiter in file for columns or strings (date)
  delim = ","

;-- column 4 number of Workshops, col 3 country, col 2 state, col 1 institute
  states     =  str_get_field(data,2,delim)
  country    =  str_get_field(data,3,delim)
  number     =  toint(str_get_field(data,4,delim))
  total      =  sum(number)

  barlabels  =  number+", "+states+", "+country
  number(0)  = 15                       ;-- just to reduce the hight
  print(barlabels)

;-- define x-axis values (not drawn), y-axis values = number
;  x = ispan(1,dimsizes(number),1)
  x = fspan(1,dimsizes(number),dimsizes(number))

;-- define labels, levels, and colors
  levels  =  (/1,2,4,6,40/)             ;-- value levels
  labels  =  ""+levels                  ;-- labelbar labels
  nlevels =  dimsizes(levels)                                  ;-- number of levels

  named_colors = (/"white","black",\
                    "lightskyblue1", \
                    "deepskyblue1", \
                    "deepskyblue3", \
                    "blue", \
                    "navy"/)

  colors =  ispan(2,dimsizes(named_colors)-1,1)                ;-- color index array
  icols  =  new(dimsizes(number),integer,-9999)                ;-- array for value color indices

;-- compute the data color array
  do i = 0,dimsizes(number)-1
     do j = 0,nlevels-2
        if(number(i).le.levels(0)) then
           icols(i) = colors(0)
        else if(number(i).gt.levels(nlevels-1)) then
           icols(i) = dimsizes(colors)+1
        else if(number(i).gt.levels(j).and.number(i).le.levels(j+1)) then
           icols(i) = colors(j+1)
        end if
        end if
        end if
     end do
     print("State: "+sprinti("%2.2i",i)+"   IPs:  "+sprinti("%4.2i",number(i))+"  "+country(i)+"/"+states(i)+"  col: "+icols(i))
  end do

;-- open a workstation and define colormap
  wks = gsn_open_wks("png","plot_NCL_bar_chart_with_text")
  gsn_define_colormap(wks,named_colors)

;-- set resources
  res                       =  True
  res@gsnFrame              =  False                 ;-- don't advance the frame yet

  res@vpXF                  =  0.08                  ;-- x-position
  res@vpYF                  =  0.92                  ;-- y-position
  res@vpWidthF              =  0.88                  ;-- width
  res@vpHeightF             =  0.65                  ;-- height

  res@tiMainString          = "NCL Workshops Worldwide"  ;-- title string
  res@tiMainFont            = "helvetica"            ;-- title string font
  res@tiMainFontHeightF     =  0.025                 ;-- set title string font size
  res@tiMainOffsetXF        = -0.23

  res@tmYROn                =  False
  res@tmYLOn                =  False
  res@tmXBOn                =  False
  res@tmXTOn                =  False

  res@trYMinF               =  0
  res@trYMaxF               =  16

  res@gsnXYBarChart         = True                 ;-- turn on bar chart
  res@gsnXYBarChartBarWidth = 0.75                 ;-- change bar widths
  res@gsnXYBarChartColors   = icols

  plot = gsn_csm_xy(wks,x,number,res)

;-- add text labels
  txres                     =  True                 ;-- text mods desired
  txres@txFontHeightF       =  0.012                ;-- default size is HUGE!
  txres@txAngleF            =  90.                  ;-- text angle
  txres@txJust              = "CenterLeft"          ;-- puts text on top of bars

  do i = 2, dimsizes(number)
     gsn_text(wks,plot,barlabels(i-1),i,number(i-1)+0.5,txres) ;-- add labels
  end do

  text = gsn_add_text(wks, plot, barlabels(0), 1.5, 13.2,txres)

  pmres                =  True
  pmres@gsMarkerColor  =  "black"
  pmres@gsMarkerIndex  =  1
  pmres@gsMarkerSizeF  =  0.015

  dum1 = gsn_add_polymarker(wks, plot, 1., 15.1, pmres)
  dum2 = gsn_add_polymarker(wks, plot, 1., 15.3, pmres)
  dum3 = gsn_add_polymarker(wks, plot, 1., 15.5, pmres)

  pmres@gsMarkerIndex  =  7
  pmres@gsMarkerSizeF  =  0.033
  pmres@gsLineThicknessF = 3.

  dum4 = gsn_add_polymarker(wks, plot, 1., 15.4, pmres)

;-- create legend
  txres2                    =  True
  txres2@txFontHeightF      =  0.016                ;-- default size is HUGE!
  txres2@txJust             = "CenterLeft"          ;-- puts text on top of bars
  txres2@txFont             =  29

  dx = 0.03
  x0 = 0.57
  x1 = 0.95
  y0 = 0.7
  y1 = 0.88
  y2 = y1+dx

  gsn_text_ndc(wks,"# "+total+"  total", x0+0.05, y2-0.03, txres2)
  gsn_text_ndc(wks,"# 61  in USA", x0+0.05, y2-(2*0.03), txres2)
  gsn_text_ndc(wks,"#  9  in Europe", x0+0.05, y2-(3*0.03), txres2)
  gsn_text_ndc(wks,"#  4  in Asia", x0+0.05, y2-(4*0.03), txres2)
  gsn_text_ndc(wks,"#  2  in Australia", x0+0.05, y2-(5*0.03), txres2)

  xp = (/x0, x1, x1, x0, x0/)
  yp = (/y0,  y0, y1, y1,  y0/)
  yp = yp+dx

  gsn_polyline_ndc(wks, xp, yp, True)

;-- Time stamp on plot
  txres3                    =  True
  txres3@txFontHeightF      =  0.008                ;-- default size is HUGE!
  txres3@txJust             = "CenterRight"         ;-- puts text on top of bars
  gsn_text_ndc(wks,"Period: 2000-2015/01", 0.17, 0.25, txres3)

;-- draw plot
  draw(plot)
  frame(wks)

end
Result: