DKRZ NCL Box-Whisker plot example#
First, the boxplot_mod function definition which should be stored in a separate file e.g. lib_boxplot_mod.ncl.
undef("boxplot_mod")
function boxplot_mod(wks:graphic,x[*]:numeric,y[*][*]:numeric,\
                     boxOpts:logical,plotres:logical,lineres:logical)
;------------------------------------------------------------------------------
; This boxplot_mod function is based on Dennis Shea's boxplot function from
; $NCARG_ROOT/lib/ncarg/nclscripts/csm/shea_util.ncl library. It's extended to
; be able to fill the boxes and add a label at the side of each box.
;
; Added resources to boxOpts:
;
;  boxLabels       boxOpts@labels = (/"label box1","label box2"/)
;  labelPosition   right or left, e.g. boxOpts@labelPosition = "right"
;  fillColorOn     turn on fill color
;  fillColors      boxOpts@fillColors = (/"green","blue"/)
;
; 16.03.18    kmf
;------------------------------------------------------------------------------
; This function creates a blank linLog plot object, on which box plots are
; created by extensive use of gsn_add_polyline. The user can draw as many or
; as few box plots as they wish. The plot is not drawn, and the frame is not
; advanced. May be used with gsn_panel. Missing data may be present in the
; input Y array, but not the input X array.
;
; The function options are as follows:
;
; wks         The workstation
; x[*]        A one-dimensional array containing the X-axis values of where
;             the box plot(s) will be drawn.
; y[*][*]     A two-dimensional array, where the rightmost dimension contains
;             the box plot reference pt. data.
;             y(n,0)=bottom_value, y(n,1)=bottom_value_of_box,
;             y(n,2)=mid-value_of_box,y(n,3)=top_value_of_box,y(n,4)=top_value
; boxOpts     2 options attached as attributes may be attached here.
; boxWidth    Scalar or array that contains the widths of the boxes.
; boxColors   Scalar or array that contains the colors that the boxes will
;             be drawn in.
;             Ex. boxOpts@boxColors =    (/"green","blue"/)
;             If the number of colors specified does not equal the number of
;             boxes drawn, only the first color specified will be used.
; plotres     An optional xy-plot resource list. Will override defaults where
;             applicable.
; lineres     An optional resource list pertaining to the lines used to draw
;             the boxes/lines.
;
; Example call: plot3 = boxplot(wks,ntime,newyval,opti,res,False)
;               draw(plot3)
;               frame(wks)
;------------------------------------------------------------------------------
begin
   dimquery = dimsizes(y)
   numbox = dimquery(0)
   boxWidths = new((/numbox/),float)

   if (numbox .ne. dimsizes(x)) then
            print("boxplot: Fatal: X must be one-dimensional and both X and Y"+\
            " must have the same leftmost dimension")
            exit
   end if

   if (any(ismissing(x))) then
            print("boxplot: Fatal: X array cannot contain missing data, exiting")
            exit
   end if

   ; Developing x-axis
   xAxis = new(numbox+2,typeof(x))
   xAxis(1:numbox) = x
   if (numbox.ne.1) then
      dx = x(1)-x(0)
      xAxis(0) = x(0)-dx
      xAxis(numbox+1) = x(numbox-1)+dx
   else
      dx = 1
      xAxis(0) = x-dx
      xAxis(2) = x+dx
   end if

   if (boxOpts) then
      if (isatt(boxOpts,"boxWidth")) then
         if (dimsizes(boxOpts@boxWidth) .ne. 1 .and. \
             dimsizes(boxOpts@boxWidth) .ne. numbox) then
             print("boxplot: Number of input box widths must either equal 1 "+\
                   "or the number of boxes ("+numbox+"). "+ \
                   "Using first specified box width only.")
             boxWidths(:) = boxOpts@boxWidth(0)
         else
             boxWidths = boxOpts@boxWidth
         end if
      else
         boxWidths(:) = dx*.3
      end if
   else
      boxWidths(:) = dx*.3
   end if

   labarr = new(numbox+2,"string")            ; Prepare actual X-axis labels...
   labarr(0) = ""
   labarr(numbox+1) = ""
   labarr(1:numbox) = xAxis(1:numbox)

   ; Whether to maximize plot in frame.
   maximize = get_res_value(plotres,"gsnMaximize",False)

   if (plotres) then
      fsatts = getvaratts(plotres)

      do ty = 0,dimsizes(fsatts)-1
         if (fsatts(ty).eq."tmXBLabels") then   ; test for XBLabels
             if (dimsizes(plotres@tmXBLabels).ne.numbox) then
                print("boxplot: Fatal:Number of XB Labels does not match "+\
                      "number of boxes, exiting")
                exit
             else
                labarr(1:numbox) = plotres@$fsatts(ty)$
             end if
             xblab = plotres@tmXBLabels
             delete(plotres@tmXBLabels)     ; Delete tmXBLabels
         end if       ;atts are assigned below...
      end do

      delete(fsatts)
   end if

   plot = create "plot" logLinPlotClass wks
            "trYMinF"                : min(y)-2
            "trYMaxF"                : max(y)+2
            "trXMinF"                : min(xAxis)
            "trXMaxF"                : max(xAxis)
            "pmTickMarkDisplayMode"  : "Always"
            "tmXBMode"               : "Explicit"
            "tmXBValues"             : xAxis
            "tmXBLabels"             : labarr
            "tmYROn"                 : False
            "tmXTOn"                 : False
            "tmYRBorderOn"           : False
            "tmXTBorderOn"           : False
            "pmTitleDisplayMode"     : "Always"       ; allow titles
            "tiMainOn"               : True
            "tiMainString"           : ""
          end create

   if (plotres) then
            attsetvalues(plot,plotres)
   end if

   polyres = True                      ; set up defaults
   polyres@gsLineColor       = "black" ; color of lines
   polyres@gsLineThicknessF  = 1.5     ; thickness of lines
   polyres@gsLineDashPattern = 0

   if (lineres) then
      fsatts = getvaratts(lineres)
      do ty = 0,dimsizes(fsatts)-1
         polyres@$fsatts(ty)$ = lineres@$fsatts(ty)$
      end do
   end if

   if (boxOpts) then
      if (isatt(boxOpts,"boxColors")) then
         boxcolor = boxOpts@boxColors
         if (dimsizes(boxcolor) .eq. 1 .or. dimsizes(boxcolor) .ne. numbox) then
            if (dimsizes(boxcolor) .ne. numbox) then
                print("boxplot: warning: Number of input colors must either "+ \
                      "equal 1 or the number of boxes ("+numbox+"). "+ \
                      "Using first specified color only.")
            end if
            polyres@gsLineColor = boxcolor(0)
            cflag = 1
         else
            cflag = 2
         end if
      else
         cflag =1
      end if
   else
      cflag = 1
   end if

;-- set label text resources
   textres =    True
   textres@txFontColor   = "black"     ;-- set text color to black
   textres@txFontHeightF =  0.012      ;-- decrease font size
   textres@txJust        = "CenterCenter"
   textres@txAngleF      =  90.        ;-- rotate text counterclockwise 90 deg.

;-- assign graphic array for polylines (outlines)
   dum = new((/numbox,9/),graphic)

;-- add graphic arrays for filled polygons and labels
   dumf  = new(numbox,graphic)
   dumtx = new(numbox,graphic)

;-- draw filled boxes and label them if turned on
   do im=0,numbox-1
      ff = xAxis(im+1)
      if(isatt(boxOpts,"fillColorOn")) then

         if(boxOpts@fillColorOn .eq. "True") then
            if(isatt(boxOpts,"fillColors")) then
               polyres@gsLineColor = "black" ;-- set to black for the outlines
               polyres@gsFillColor =    boxOpts@fillColors(im)
               cflag = 1
            end if
            pxl = (ff-(boxWidths(im)/2.))
            pxr = (ff+(boxWidths(im)/2.))
            px    = (/pxl,pxr,pxr,pxl,pxl/)
            py    = (/y(im,3),y(im,3),y(im,1),y(im,1),y(im,3)/)
            dumf(im) = gsn_add_polygon(wks,plot,px,py,polyres)
         end if

         if(isatt(boxOpts,"boxLabels")) then
            if(isatt(boxOpts,"labelPosition")) then
               if(boxOpts@labelPosition .eq. "right") then
                        txx = (ff+(boxWidths(im)/2.)) + (boxWidths(im)/2.)
               else if(boxOpts@labelPosition .eq. "left") then
                        txx = (ff-(boxWidths(im)/2.)) - (boxWidths(im)/2.)
               end if
               end if
            end if
            label = boxOpts@boxLabels(im)
            txy       = y(im,3) - (y(im,3)-y(im,1))/2.

            dumtx(im) = gsn_add_text(wks,plot,label,txx,txy,textres)
         end if
      end if
   end do

;-- create the polylines for the box-whisker plot
   do gg = 0,numbox-1
      ff = xAxis(gg+1)

      if (cflag.eq.2) then
                  polyres@gsLineColor = boxcolor(gg)
      end if

      yy = (/y(gg,4),y(gg,4)/)
      xx = (/(ff-(boxWidths(gg)/8.)),(ff+(boxWidths(gg)/8.))/)
      if (.not.(any(ismissing(xx).or.ismissing(yy)))) then
               dum(gg,0) = gsn_add_polyline(wks,plot,xx,yy,polyres)
      end if

      yy = (/y(gg,3),y(gg,4)/)
      xx = (/ff,ff/)
      polyres@gsLineDashPattern = 1
      if (.not.(any(ismissing(xx).or.ismissing(yy)))) then
               dum(gg,1) = gsn_add_polyline(wks,plot,xx,yy,polyres)
      end if
      polyres@gsLineDashPattern = 0

      yy = (/y(gg,3),y(gg,3)/)
      xx = (/(ff-(boxWidths(gg)/2.)),(ff+(boxWidths(gg)/2.))/)
      if (.not.(any(ismissing(xx).or.ismissing(yy)))) then
               dum(gg,2) = gsn_add_polyline(wks,plot,xx,yy,polyres)
      end if

      yy = (/y(gg,1),y(gg,3)/)
      xx = (/(ff-(boxWidths(gg)/2.)),(ff-(boxWidths(gg)/2.))/)
      if (.not.(any(ismissing(xx).or.ismissing(yy)))) then
               dum(gg,3) = gsn_add_polyline(wks,plot,xx,yy,polyres)
      end if

      yy = (/y(gg,2),y(gg,2)/)
      xx = (/(ff-(boxWidths(gg)/2.)),(ff+(boxWidths(gg)/2.))/)
      if (.not.(any(ismissing(xx).or.ismissing(yy)))) then
               dum(gg,4) = gsn_add_polyline(wks,plot,xx,yy,polyres)
      end if

      yy = (/y(gg,1),y(gg,3)/)
      xx = (/(ff+(boxWidths(gg)/2.)),(ff+(boxWidths(gg)/2.))/)
      if (.not.(any(ismissing(xx).or.ismissing(yy)))) then
               dum(gg,5) = gsn_add_polyline(wks,plot,xx,yy,polyres)
      end if

      yy = (/y(gg,1),y(gg,1)/)
      xx = (/(ff-(boxWidths(gg)/2.)),(ff+(boxWidths(gg)/2.))/)
      if (.not.(any(ismissing(xx).or.ismissing(yy)))) then
               dum(gg,6) = gsn_add_polyline(wks,plot,xx,yy,polyres)
      end if

      yy = (/y(gg,0),y(gg,1)/)
      xx = (/ff,ff/)
      polyres@gsLineDashPattern = 1
      if (.not.(any(ismissing(xx).or.ismissing(yy)))) then
               dum(gg,7) = gsn_add_polyline(wks,plot,xx,yy,polyres)
      end if
      polyres@gsLineDashPattern = 0

      yy = (/y(gg,0),y(gg,0)/)
      xx = (/(ff-(boxWidths(gg)/8.)),(ff+(boxWidths(gg)/8.))/)
      if (.not.(any(ismissing(xx).or.ismissing(yy)))) then
               dum(gg,8) = gsn_add_polyline(wks,plot,xx,yy,polyres)
      end if

   end do

;-- add graphic objects to the plot
   dumname = unique_string("dum")
   plot@$dumname$ = dum

   if(isatt(boxOpts,"fillColorOn")) then
            if(boxOpts@fillColorOn .eq. "True") then
                     dumfname = unique_string("dumf")
                     plot@$dumfname$ = dumf
            end if
   end if

   if(isatt(boxOpts,"boxLabels")) then
            dumtxname = unique_string("dumtx")
            plot@$dumtxname$ = dumtx
   end if

   if (isvar("xblab") .eq. "True") then
            plotres@tmXBLabels = xblab   ; reassign XBLabels
   end if

   if (maximize) then
            mres = True
            mres@gsnDraw    = False
            mres@gsnFrame = False
            maximize_output(wks,mres)
   end if

   return(plot)
end
Example plot source code which calls boxplot_mod:
; -----------------------------------------------------------------------------
; DKRZ NCL Example: test_boxplot_mod_data.ncl
;
; Description: box-whisker plot
;
; - fill the boxes with defined colors
; - add labels to the box sides
;
; Thanks to Yohei Takano for the idea and the base script.
;
; 19.03.18 kmf
; -----------------------------------------------------------------------------
; load the local boxplot_mod function (based on Dennis Shea's boxplot function)
load "./lib_boxplot_mod.ncl"
begin
;-- open file and read the variable
f = addfile("$HOME/data/Hadley-Center/HadISST_sst_ym.nc","r")
time = f->time
utc_date = cd_calendar(time, 0) ;-- convert time to strings
year = toint(utc_date(:,0)) ;-- YYYY
tmin = 1950
tmax = max(year)
t_ind = ind(year .ge. tmin)
nyear = dimsizes(t_ind)
ntimes = ispan(0,nyear-1,1) ;-- years in total
sst = f->sst(t_ind,0,0)
;-- remove the linear trend
rc_sst = regCoef(ntimes,sst) ;-- calculate the linear regression
ltr_sst = rc_sst*ntimes ;-- linear regression over all years
;-- linear trend estimate
sst_d = sst - ltr_sst
;-- statistics for Box-Whisker plot
opt = True
opt@PrintStat = False
stat = stat_dispersion(sst_d,opt) ;-- compute a number of robust statistics
;-- assign array to hold the statistics
yb = new((/2,5/),"float",-999.)
yb(0,0) = stat(2) ;-- min
yb(0,1) = stat(6) ;-- low quartile (25%)
yb(0,2) = stat(8) ;-- median
yb(0,3) = stat(10) ;-- high quartile (75%)
yb(0,4) = stat(14) ;-- max
yb(1,0) = stat(2) ;-- min
yb(1,1) = stat(6) ;-- low quartile (25%)
yb(1,2) = stat(8) ;-- median
yb(1,3) = stat(10) ;-- high quartile (75%)
yb(1,4) = stat(14) ;-- max
;-- open a workstation
wks_type = "png"
wks_type@wkWidth = 1200
wks_type@wkHeight = 1200
wks = gsn_open_wks(wks_type,"plot_box_whisker_fill_color_label")
;-- assign graphics array
plot = new(2,graphic)
;-- y-axis range
ymin = 5
ymax = 20
;-- font size of titles and axis labels
font_size = 0.015
;-- timeseries resources - xy-plot
res = True
res@gsnDraw = False
res@gsnFrame = False
res@vpXF = 0.093
res@vpYF = 0.70
res@vpWidthF = 0.40
res@vpHeightF = 0.25
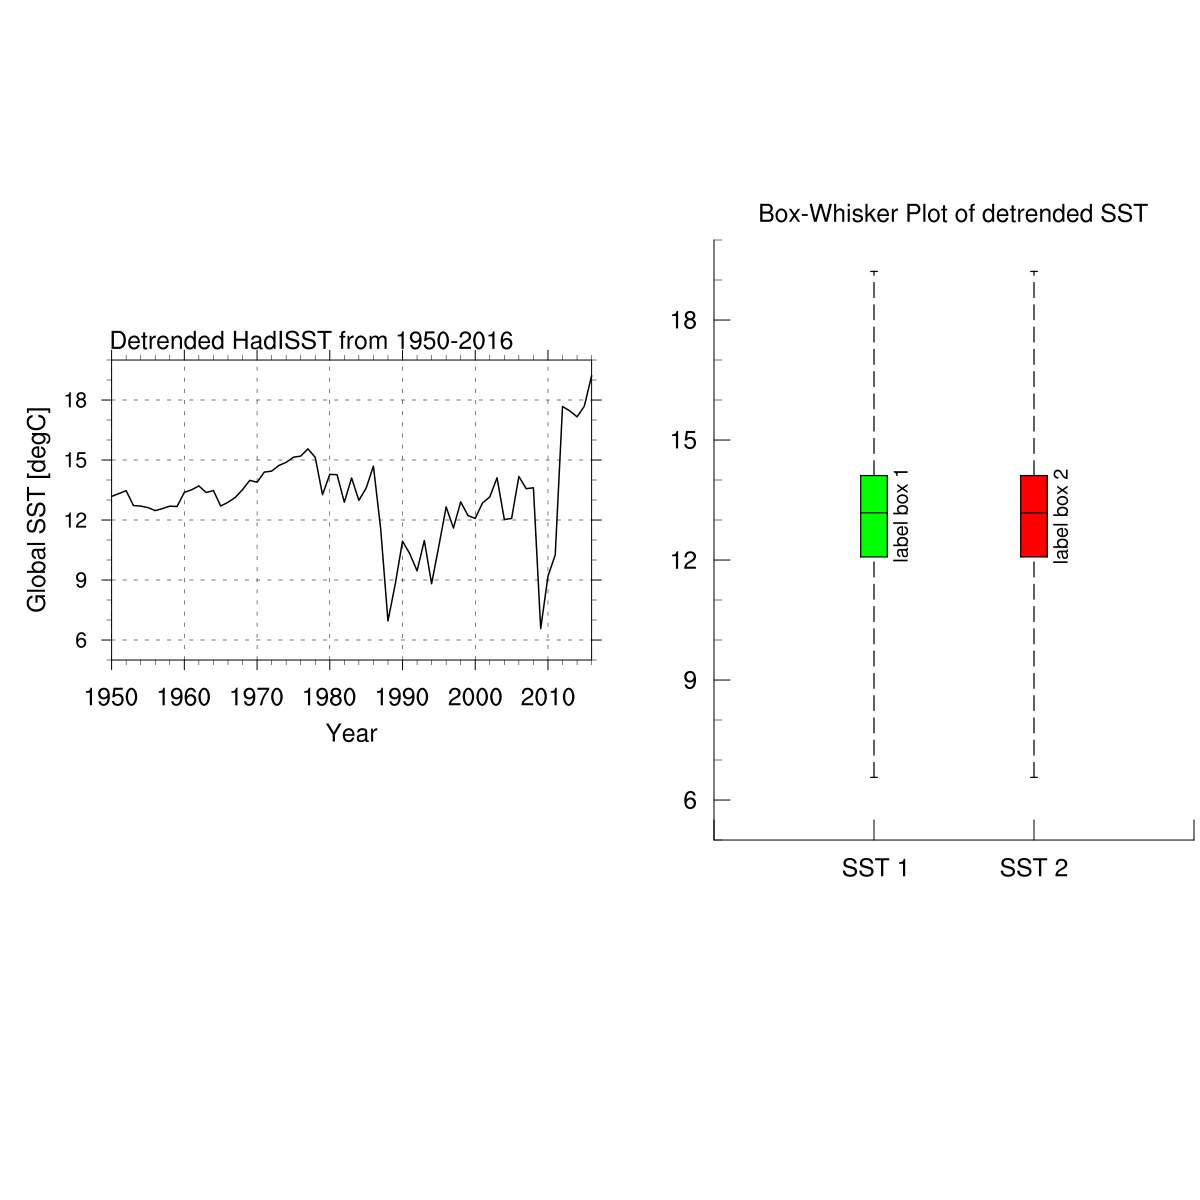
res@gsnLeftString = "Detrended HadISST from "+tmin+"-"+tmax
res@gsnRightString = " "
res@gsnLeftStringFontHeightF = font_size
res@gsnRightStringFontHeightF = font_size
res@tiXAxisString = "Year"
res@tiYAxisString = "Global SST [degC]"
res@tiXAxisFontHeightF = font_size
res@tiYAxisFontHeightF = font_size
res@tmXBLabelFontHeightF = font_size
res@tmYLLabelFontHeightF = font_size - 0.002
res@tmXMajorGrid = True
res@tmXMajorGridThicknessF = 1.0
res@tmXMajorGridLineDashPattern = 2
res@tmYMajorGrid = True
res@tmYMajorGridThicknessF = 1.0
res@tmYMajorGridLineDashPattern = 2
res@trXMinF = tmin
res@trXMaxF = tmax
res@trYMinF = ymin
res@trYMaxF = ymax
res@xyLineColor = "black"
res@xyLineThicknessF = 3.0
res@xyDashPattern = 0
;-- create the first plot - timeseries
plot(0) = gsn_csm_xy(wks, year(t_ind), sst_d, res)
;-- resources for the second plot
resBW = True
resBW@vpXF = 0.595
resBW@vpYF = 0.80
resBW@vpWidthF = 0.40
resBW@vpHeightF = 0.50
resBW@trYMinF = res@trYMinF
resBW@trYMaxF = res@trYMaxF
resBW@tiMainString = "Box-Whisker Plot of detrended SST"
resBW@tiMainFontHeightF = font_size
resBW@tmXBLabels = (/"SST 1","SST 2"/)
resBW@tmXBLabelFontHeightF = font_size
resBW@tmYLLabelFontHeightF = font_size
lresBW = True
lresBW@gsLineThicknessF = 2.5
;-- Box-Whisker plot resources
OptBW = True
OptBW@boxWidth = 1.0
OptBW@fillColorOn = True ;-- turn fill color on
OptBW@fillColors = (/"green","red"/) ;-- set fill colors
OptBW@labelPosition = "right" ;-- label position "right" or "left"
OptBW@boxLabels = (/"label box 1","label box 2"/) ;-- set box labels
;-- where to draw the boxes at the x-axis
xb = (/-5., 1/)
;-- create the second plot - boxplot
plot(1) = boxplot_mod(wks, xb, yb, OptBW, resBW, lresBW)
;-- draw the plots and advance the frame
draw(plot(0))
draw(plot(1))
frame(wks)
end
Result: