DKRZ NCL color map example - use gsn_define_colormap()#
Example script:
;-----------------------------------------------------------------------------------
; DKRZ NCL Example: color_wks_use_gsn_define_colormap.ncl
;
; Description: Demonstrate the use gsn_define_colormap() to set a color map
; for all plots of a frame (file/page).
;
; After a frame is advanced when gsnFrame is set to True or
; frame(wks) is used the color map is fixed for that frame
; but for the next frame it can change.
;
; Two PNG files will be created
;
; plot_color_wks_use_gsn_define_colormap.000001.png
; plot_color_wks_use_gsn_define_colormap.000002.png
;
; 12.03.18 kmf
;-----------------------------------------------------------------------------------
begin
f = addfile("./rectilinear_grid_2D.nc","r")
var = f->tsurf(0,:,:)
;-- open workstation (frame)
wks = gsn_open_wks("png","plot_color_wks_use_gsn_define_colormap")
gsn_define_colormap(wks,"BlWhRe") ;-- doesn't contain grays
;-- set common resources
res = True
res@gsnMaximize = True
res@cnFillOn = True ;-- turn on contour fill
res@cnLinesOn = False ;-- turn off contour lines
res@cnLineLabelsOn = False ;-- turn off line labels
res@cnLevelSelectionMode = "ManualLevels" ;-- set contour levels manually
res@cnMinLevelValF = 250. ;-- minimum contour level
res@cnMaxLevelValF = 310. ;-- maximum contour level
res@cnLevelSpacingF = 1 ;-- contour level spacing
res@lbLabelStride = 4
res@lbBoxMinorExtentF = 0.15 ;-- decrease the height of the labelbar
res@tiMainFontHeightF = 0.02
res@tiMainString = "plot" ;-- title string
;-- this plot will be drawn directly and the first frame is created (first plot file or first page)
plot = gsn_csm_contour_map(wks, var, res)
;-------------------------------------------------------------------------------------------
;-- now, we want to see what happens when we make some changes to the color map and draw the
;-- plots in memory to create a panel
;-------------------------------------------------------------------------------------------
res@gsnDraw = False
res@gsnFrame = False
res@tiMainString = "plot 1" ;-- title string
plot1 = gsn_csm_contour_map(wks, var, res)
;-- let's change the last two color indices 100 and 102 to light grays
colors = gsn_retrieve_colormap(wks) ;-- retrieve color map for editing. dimensioned (103,3)
colors(100,:) = (/ .60, .60, .60 /) ;-- replace the last color with a medium gray
colors(102,:) = (/ .80, .80, .80 /) ;-- replace the last color with a light gray
;-- set color map to new colors array
gsn_define_colormap(wks,colors) ;-- redefine colormap to workstation, color map now includes a gray
;-- see what happens with the second plot
res@tiMainString = "plot 2" ;-- title string
;-- second plot created in memory!
plot2 = gsn_csm_contour_map(wks, var, res)
;-- generate the panel, draw all plots and advance the frame
gsn_panel(wks,(/plot1,plot2/),(/2,1/),True)
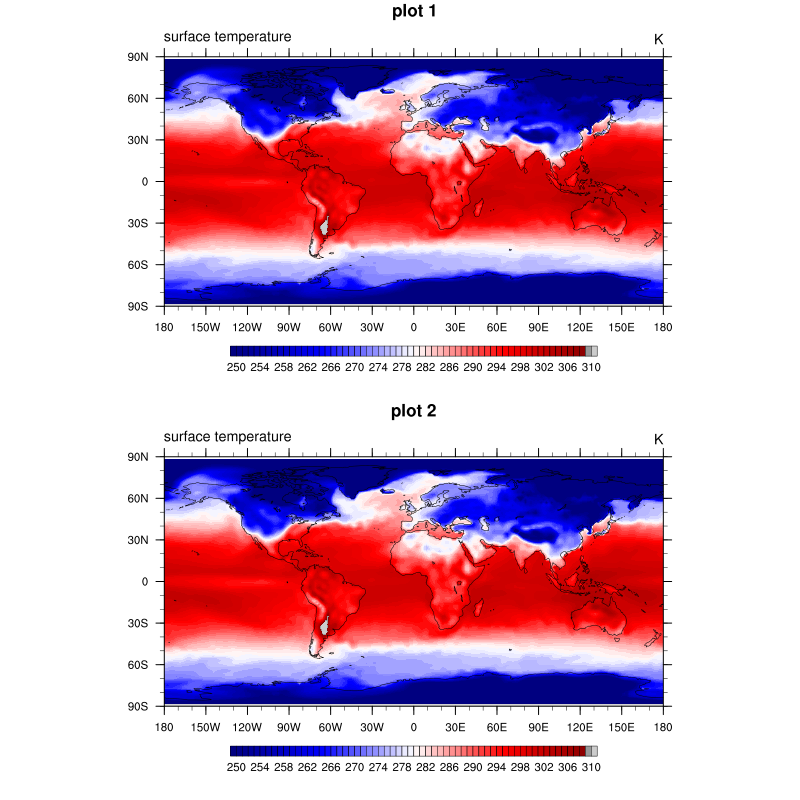
;-- You will see two identical plots in the panel even if you have expected that the upper
;-- plot should look like the first frame (no grays). This is caused by the creation of the
;-- plots in memory, the colors can be changed but will be valid after the changes to both
;-- plots. Only the advance of a frame will stop this behavior and you can change the color
;-- for the next frame.
end
Result: