DKRZ NCL color map example - use named colors#
Example script:
;-----------------------------------------------------------------------------------
; DKRZ NCL Example: color_use_named_colors_for_colormap.ncl
;
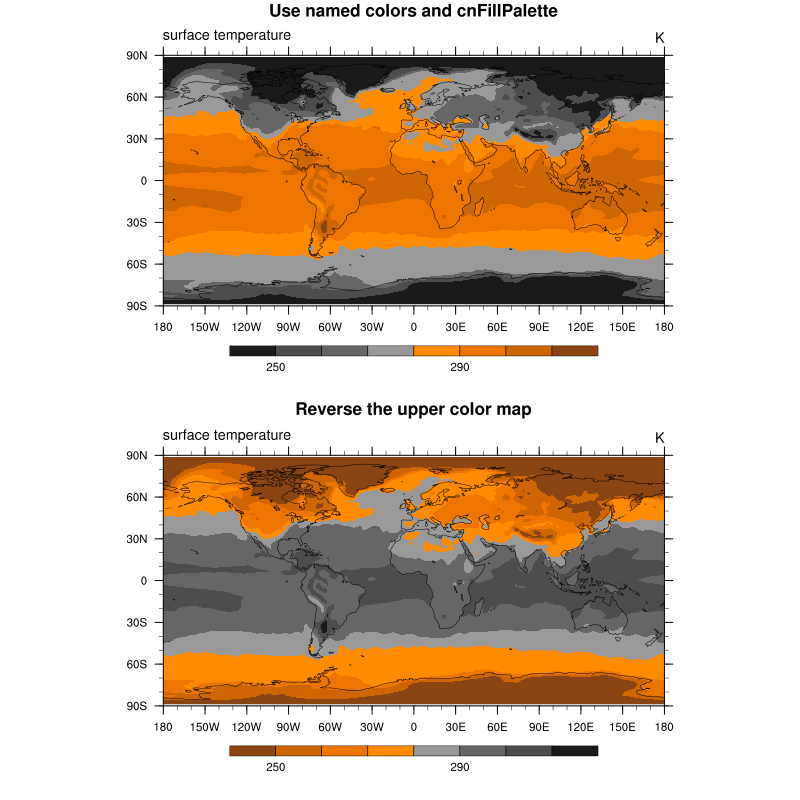
; Description: Demonstrate the use of named colors to define a color map.
; Use the reversed color map of the upper plot for the lower
; plot within the same frame.
;
; Can be used with
; cnFillPalette colormap to be used for a filled contour plot
; vcLevelPalette colormap to be used in a filled vector plot
; stLevelPalette colormap to be used in a filled streamlines plot
; 12.03.18 kmf
;-----------------------------------------------------------------------------------
begin
f = addfile("./rectilinear_grid_2D.nc","r")
var = f->tsurf(0,:,:)
colors1 = (/"gray10","gray20","gray30","gray40","gray50","gray60","gray70",\
"darkorange","darkorange1","darkorange2","darkorange3","darkorange4",\
"chocolate4"/)
colors2 = colors1(::-1)
;-- open workstation (frame)
wks = gsn_open_wks("png","plot_color_use_named_colors_for_colormap")
;-- set common resources
res = True
res@gsnDraw = False
res@gsnFrame = False
res@gsnMaximize = True
res@cnFillOn = True ;-- turn on contour fill
res@cnLinesOn = False ;-- turn off contour lines
res@cnLineLabelsOn = False ;-- turn off line labels
res@cnLevelSelectionMode = "ManualLevels" ;-- set contour levels manually
res@cnMinLevelValF = 250. ;-- minimum contour level
res@cnMaxLevelValF = 310. ;-- maximum contour level
res@cnLevelSpacingF = 10. ;-- contour level spacing
res@lbLabelStride = 4
res@lbBoxMinorExtentF = 0.15 ;-- decrease the height of the labelbar
res@tiMainFontHeightF = 0.02
;-- draw the first plot in memory
res@tiMainString = "Use named colors and cnFillPalette" ;-- title string
res@cnFillPalette = colors1 ;-- color map array
plot1 = gsn_csm_contour_map(wks, var, res)
;-- draw the second plot in memory
res@tiMainString = "Reverse the upper color map" ;-- title string
res@cnFillPalette = colors2 ;-- reversed color map colors1
plot2 = gsn_csm_contour_map(wks, var, res)
;-- generate the panel and advance the frame
gsn_panel(wks,(/plot1,plot2/),(/2,1/),True)
end
Result: