DKRZ NCL contour curvilinear example#
DKRZ NCL example script:
;-----------------------------------------------------------------
; DKRZ NCL Example: NCL_bipolar_grid_MPI-ESM.ncl
;
; 30.10.14 kmf
;-----------------------------------------------------------------
begin
;-- define filen name
diri = "./"
fili = "tos_ocean_bipolar_grid.nc"
;-- open file and read variable
f = addfile(diri+fili, "r")
tos = f->tos
tos@lat2d = f->lat
tos@lon2d = f->lon
var = tos(0,:,:)
;-- define the workstation (plot type and name)
wks = gsn_open_wks("png","plot_curvilinear_MPI-ESM")
;-- set resources
res = True
res@gsnMaximize = True ;-- maximize graphics output
res@gsnAddCyclic = True ;-- add cyclic point
res@mpMinLonF = -40.0
res@mpMaxLonF = 40.0
res@mpMinLatF = 20.0
res@mpMaxLatF = 90.0
res@cnFillOn = True ;-- turn on contour fill
res@cnFillMode = "CellFill" ;-- use CellFill method
res@cnLinesOn = False ;-- Turn lines off
res@cnLineLabelsOn = False ;-- Turn labels off
res@cnCellFillEdgeColor = 1 ;-- black edge lines
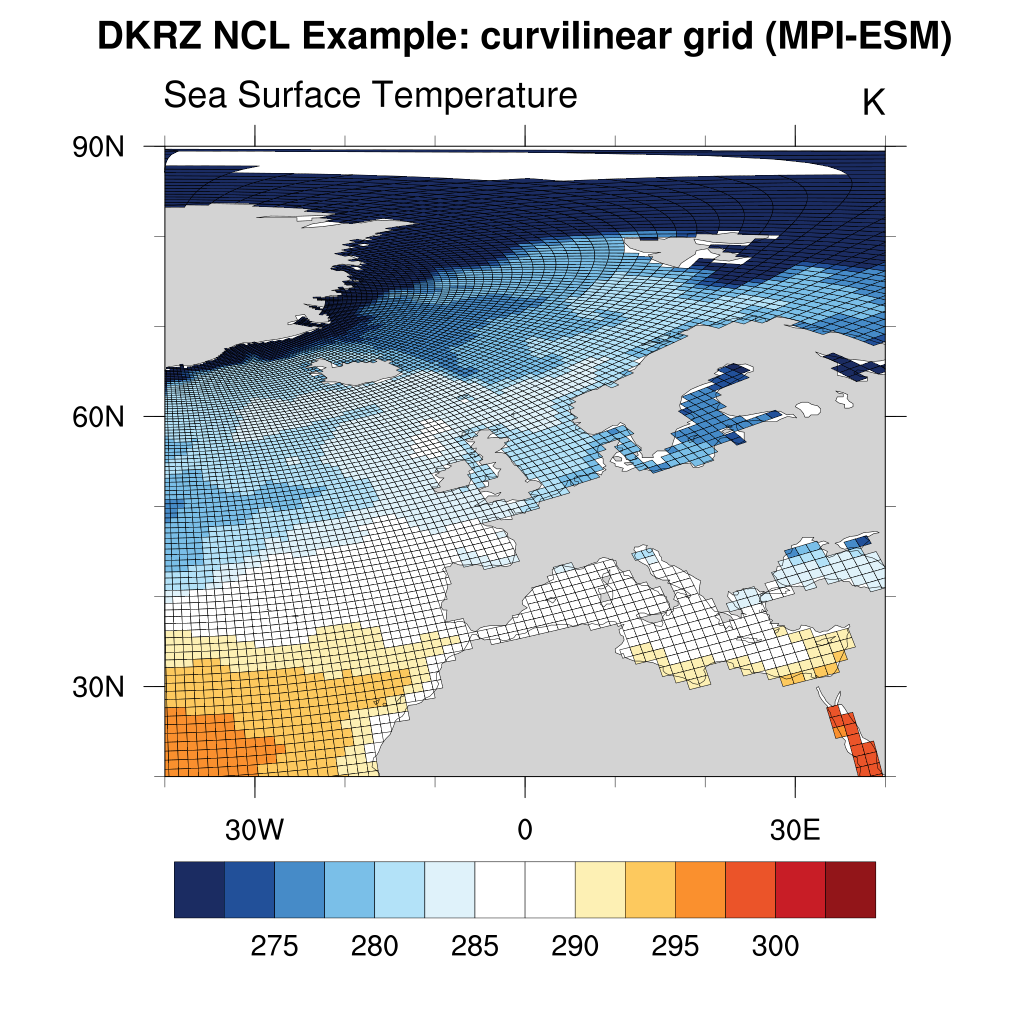
res@tiMainString = "DKRZ NCL Example: curvilinear grid (MPI-ESM)" ;-- title string
res@tiMainFontHeightF = 0.02 ;-- title font size
;-- draw the contour map
plot = gsn_csm_contour_map(wks,var,res)
end
Result: