DKRZ NCL contour filled example for rectilinear grid#
DKRZ NCL example script:
;-----------------------------------------------------------------
;
; NCL Doc Example: NCL_filled_contour_map.ncl
;
; 30.10.14 kmf
;-----------------------------------------------------------------
begin
;-- set file name
diri = "./"
fili = "rectilinear_grid_2D.nc"
;-- open file and read variable
f = addfile(diri+fili, "r")
var = f->tsurf(0,:,:)
;-- define the workstation (plot type and name)
wks = gsn_open_wks("png","plot_contour_filled_rect")
;-- set resources
res = True
res@gsnMaximize = True ;-- maximize graphics output
res@cnFillOn = True ;-- turn on contour fill
res@cnLinesOn = False ;-- turn off contour lines
res@cnLineLabelsOn = False ;-- turn off line labels
res@cnLevelSelectionMode = "ManualLevels" ;-- set contour levels manually
res@cnMinLevelValF = 250. ;-- minimum contour level
res@cnMaxLevelValF = 310. ;-- maximum contour level
res@cnLevelSpacingF = 2 ;-- contour level spacing
res@lbBoxMinorExtentF = 0.15 ;-- decrease the height of the labelbar
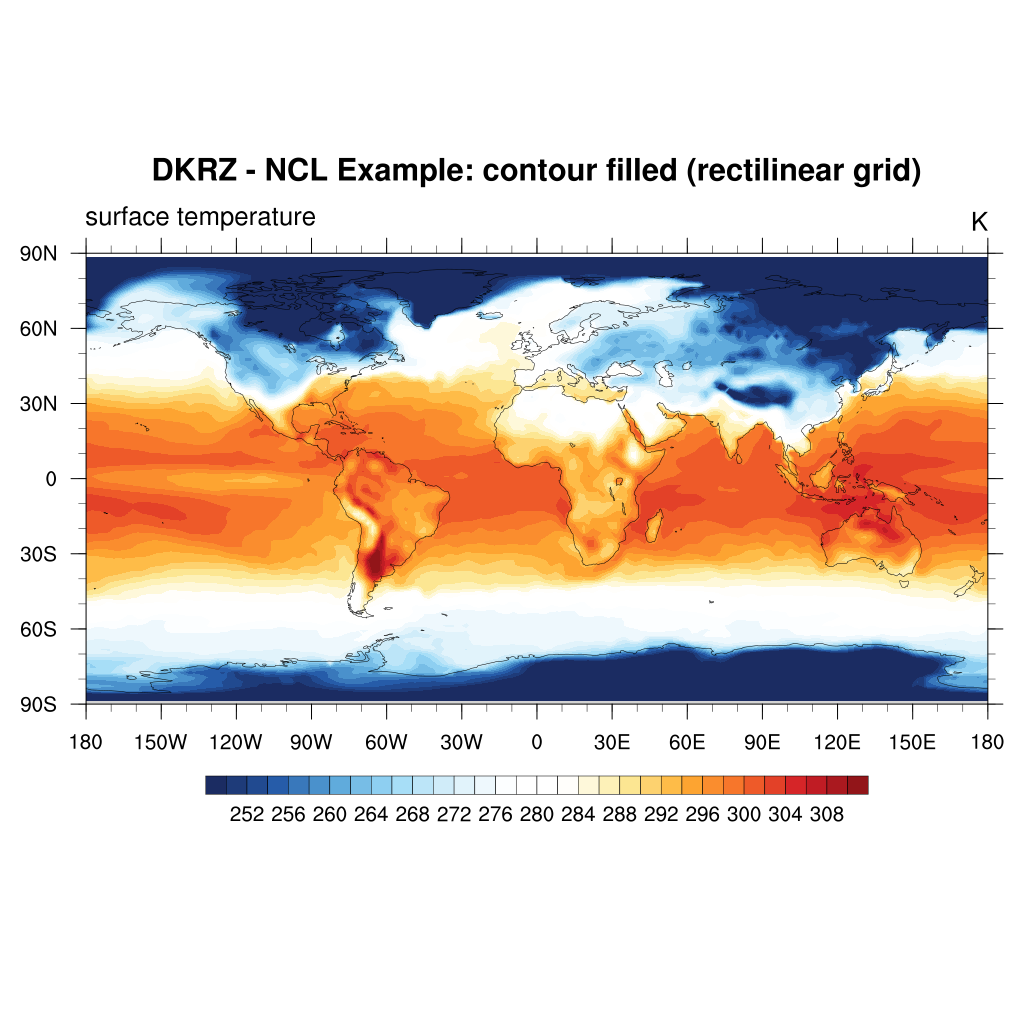
res@tiMainString = "DKRZ - NCL Example: contour filled (rectilinear grid)" ;-- title string
res@tiMainFontHeightF = 0.02
;-- draw the contour map
plot = gsn_csm_contour_map(wks, var, res)
end
Result: