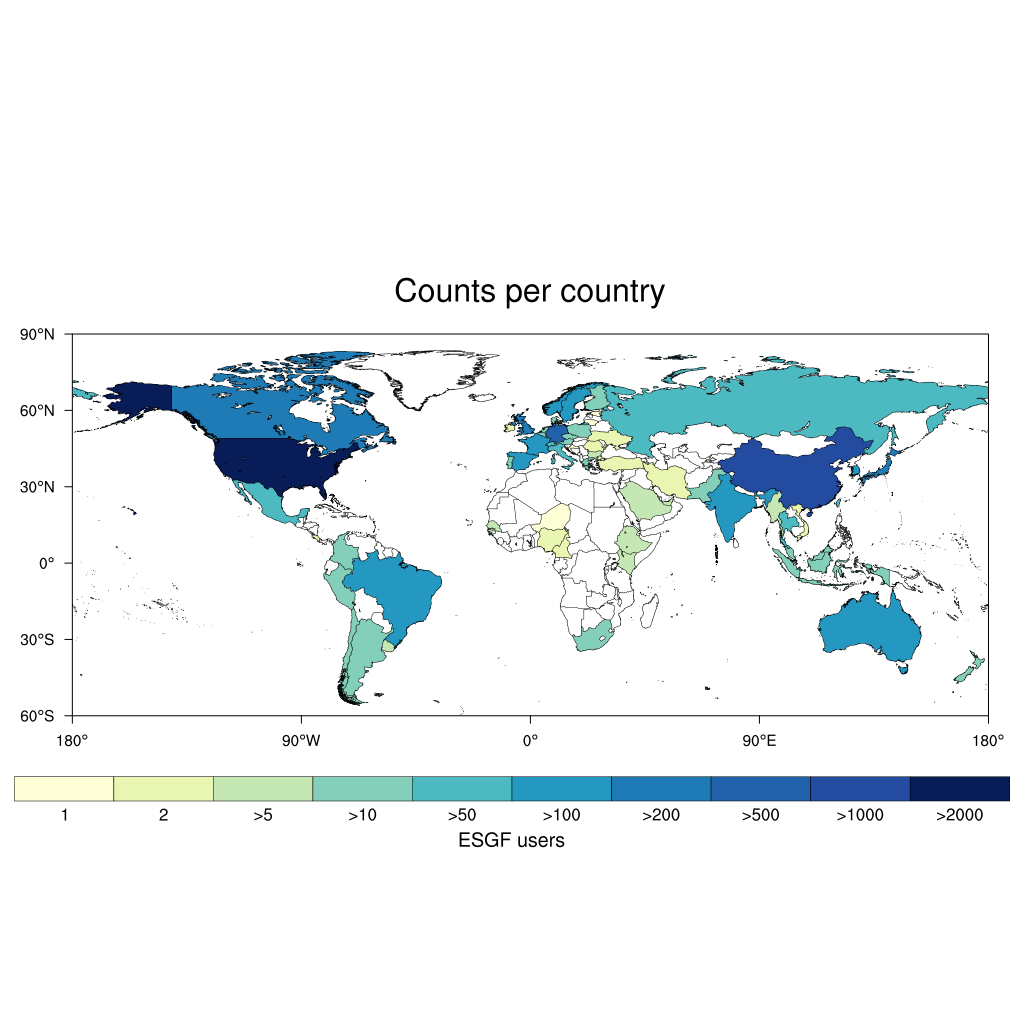
DKRZ NCL counts per country map plot example#
Example script:
;---------------------------------------------------------------
;-- DKRZ NCL example:     NCL_read_ASCII_and_plot_counts_per_country.ncl
;--
;-- Input file:           country_gesamt.txt
;--
;-- Data type:            ASCII
;--
;-- Data format:          Country name (type string) ; number (type integer)
;-- Delimiter:            ;
;--
;-- Settings:             map,
;--                       mpOutlineBoundarySets,
;--                       mpFillAreaSpecifiers,
;--                       mpSpecifiedFillColors
;--
;-- 15.03.16  kmf
;---------------------------------------------------------------
begin

  data    =  asciiread("../data/country_gesamt.txt", -1,"string") ;-- read all lines
  delim   = ";"                                                ;-- set delimiter
  nfields =  str_fields_count(data(0),delim)                   ;-- count numbere of columns

  states  =  str_get_field(data,1,delim)                       ;-- !!!! 1 = column number (not index)
  ivalues =  stringtoint(str_get_field(data,2,delim))          ;-- !!!! 2 = column number (not index)

  levels  =  (/1,2,5,10,50,100,200,500,1000,2000/)             ;-- value levels
  labels  =  (/"1","2",">5",">10",">50",">100",">200",">500",">1000",">2000"/) ;-- labelbar labels

  named_colors = (/"white","black",\
                   "(/0.997785, 0.999139, 0.846059/)", \
                   "(/0.910127, 0.964937, 0.695640/)", \
                   "(/0.769320, 0.909419, 0.706959/)", \
                   "(/0.521292, 0.812964, 0.731073/)", \
                   "(/0.304483, 0.732118, 0.761430/)", \
                   "(/0.141961, 0.597647, 0.756078/)", \
                   "(/0.122107, 0.483137, 0.712711/)", \
                   "(/0.131949, 0.382745, 0.665467/)", \
                   "(/0.138408, 0.297578, 0.624990/)", \
                   "(/0.031373, 0.113725, 0.345098/)"/)

  colors  =  ispan(2,dimsizes(named_colors)+1,1)               ;-- color index array
  nlevels =  dimsizes(levels)                                  ;-- number of levels
  icols   =  new(dimsizes(ivalues),integer)                    ;-- array for value color indices

;-- compute the data color array
  do i = 0,dimsizes(ivalues)-1
     if(ivalues(i).eq.levels(0)) then
        icols(i) = 0
     end if
     if(ivalues(i).gt.levels(nlevels-1)) then
        icols(i) = dimsizes(colors)-1
     end if
     do j = 0,nlevels-2
        if(ivalues(i).gt.levels(j).and.ivalues(i).le.levels(j+1)) then
           icols(i) = colors(j)
        end if
     end do
     print("State: "+sprinti("%2.2i",i)+"   IPs:  "+sprinti("%4.2i",ivalues(i))+"  "+states(i))
  end do

;-- open a workstation and set workstation resources
  wks_type                 = "png"                  ;-- plot output type
  wks_type@wkWidth         =  1024                  ;-- wk width
  wks_type@wkHeight        =  1024                  ;-- wk height
  wks = gsn_open_wks(wks_type,"plot_counts_per_country_map_blue")

;-- define colormap
  gsn_define_colormap(wks,named_colors)

;-- set resources
  res                       =  True
  res@gsnMaximize           =  True                  ;-- maximize plot
  res@gsnFrame              =  False                 ;-- don't advance the frame yet

  res@vpXF                  =  0.01                  ;-- x-position
  res@vpYF                  =  0.95                  ;-- y-position
  res@vpWidthF              =  0.98                  ;-- width
  res@vpHeightF             =  0.95                  ;-- height

  res@pmTickMarkDisplayMode = "Always"               ;-- turn on map tickmarks

  res@mpDataSetName         = "Earth..4"             ;-- new database
  res@mpDataBaseVersion     = "MediumRes"            ;-- Medium resolution database
  res@mpOutlineOn           =  True                  ;-- turn on map outlines
  res@mpFillOn              =  True                  ;-- turn on map fill
  res@mpOutlineBoundarySets = "National"             ;-- draw only national bounds
  res@mpLandFillColor       = "Background"           ;-- set map land fill to white

  res@mpMinLatF             = -60                    ;-- don't plot Antarctica

  res@tmXBLabelFontHeightF  =  0.012                 ;-- change XB label font size
  res@tmYLLabelFontHeightF  =  0.012                 ;-- change YL label font size
  res@tmXBMajorLengthF      =  0.008                 ;-- change XB the tickmark length
  res@tmYLMajorLengthF      =  0.008                 ;-- change YL the tickmark length

  res@tiMainString          = "Counts per country"   ;-- title string
  res@tiMainFont            = "helvetica"            ;-- title string font
  res@tiMainFontHeightF     =  0.025                 ;-- set title string font size

;-- set colors and states
  res@mpFillAreaSpecifiers  =  states                ;-- fill listed states
  res@mpSpecifiedFillColors =  icols                 ;-- use generated color array

  map = gsn_csm_map(wks,res)    ;-- create the map

;-- add custom label bar to the plot
  lbres                     =  True
  lbres@lbPerimOn           =  False                 ;-- no label bar box outline
  lbres@lbOrientation       = "Horizontal"           ;-- labelbar orientation
  lbres@vpXF                =  0.01                  ;-- labelbar x-position
  lbres@vpYF                =  0.26                  ;-- labelbar y-position
  lbres@vpWidthF            =  0.98                  ;-- labelbar width
  lbres@vpHeightF           =  0.08                  ;-- labelbar height
  lbres@lbLabelFontHeightF  =  0.012                 ;-- label font height
  lbres@lbMonoFillPattern   =  True                  ;-- fill sold
  lbres@lbAutoManage        =  False                 ;-- make settings by yourself
  lbres@lbLabelAlignment    = "BoxCenters"           ;-- where to draw the labelbar labels
  lbres@lbFillColors        =  colors                ;-- use colors

  gsn_labelbar_ndc(wks,nlevels,labels,0.13,0.28,lbres) ;-- draw the labelbar

  txres                =  True
  txres@txJust         = "CenterCenter"
  txres@txFontHeightF  =  0.014

  gsn_text_ndc(wks,"ESGF users",0.5,0.18,txres)

  frame(wks)                                         ;-- advance the frame
end
Result: