DKRZ NCL daily climatology#
Example script:
;--------------------------------------------------------------------
; DKRZ NCL example: compute_daily_climatology_and_draw_timeseries.ncl
;
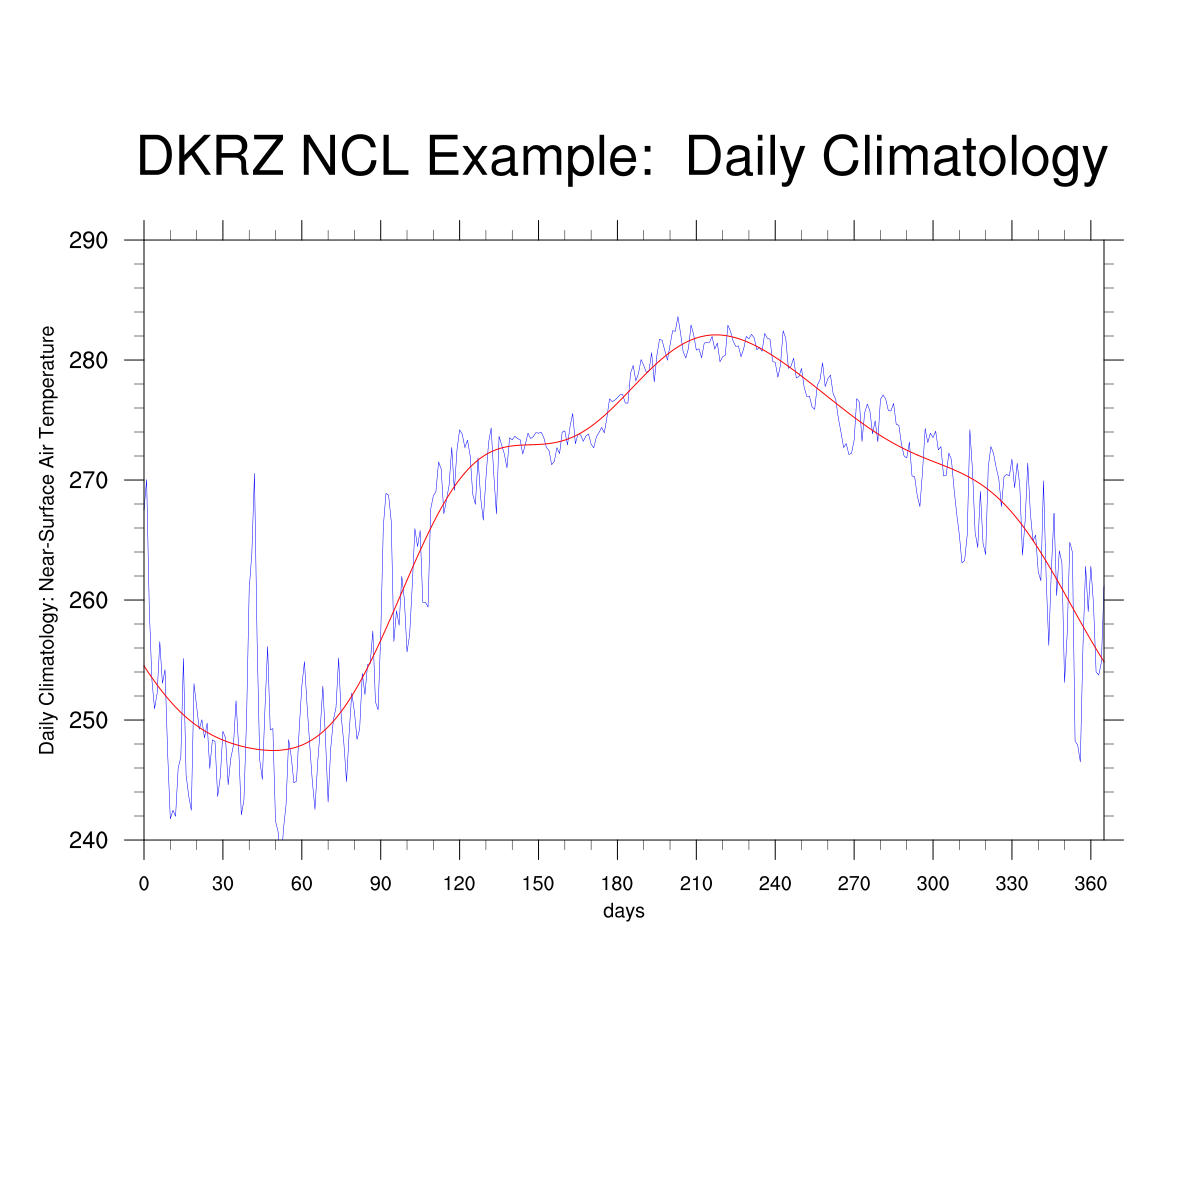
; Description: compute the daily climatology; raw and smooth
;--------------------------------------------------------------------
begin
f = addfile("tas_day_MPI-ESM-LR_rcp45_r1i1p1_20060101-20091231.nc","r")
time = f->time ;-- get time values
ymdStrt = 20060101 ;-- start yyyymmdd
ymdLast = 20061231 ;-- last
yrStrt = ymdStrt/10000
yrLast = ymdLast/10000
ymd = cd_calendar(time, -2) ;-- yyyymmdd
iStrt = ind(ymd .eq. ymdStrt) ;-- index start
iLast = ind(ymd .eq. ymdLast) ;-- index last
delete([/time,ymd/])
time = f->time(iStrt:iLast) ;-- time:units = "hours since"
TIME = cd_calendar(time, 0) ;-- type float
year = toint(TIME(:,0))
month = toint(TIME(:,1))
day = toint(TIME(:,2))
ddd = day_of_year(year, month, day)
yyyyddd = year*1000 + ddd ;-- needed for input
tas = f->tas(iStrt:iLast,:,:) ;-- read variable within time range
;-- compute daily climatology
tasClmDay = clmDayTLL(tas, yyyyddd) ;-- daily climatology at each grid point
tasClmDay_sm = smthClmDayTLL(tasClmDay,4) ;-- daily climatology - smoothed
;-- set lat/lon where to compute the climatology
lat = 60
lon = 270
;-- create data array containing both climatologies
data = new ( (/2,366/), typeof(tasClmDay), getFillValue(tasClmDay))
data(0,:) = tasClmDay(:,{lat},{lon})
data(1,:) = tasClmDay_sm(:,{lat},{lon})
;-- create x-axis values
x = ispan(0,365,1)
x@units = "days"
;-- convert a mixed Julian/Gregorian date to a UT-referenced date
utc_date = cd_calendar(time, 0)
year = toint(utc_date(:,0))
month = toint(utc_date(:,1))
day = toint(utc_date(:,2))
date_str = sprinti("%0.4i-",year)+sprinti("%0.2i-",month)+sprinti("%0.2i",day)
;-- open workstation
wks_type = "png"
wks_type@wkWidth = 1200
wks_type@wkHeight = 1200
wks = gsn_open_wks(wks_type,"plot_daily_climatology") ;-- open a workstation
;-- set resources
res = True
res@vpHeightF = 0.5 ;-- viewport height
res@vpWidthF = 0.8 ;-- viewport width
res@vpXF = 0.12 ;-- viewport x-position
res@trXMinF = min(x) ;-- x-axis min value
res@trXMaxF = max(x) ;-- x-axis max value
res@trYMinF = 240.0 ;-- y-axis min value
res@trYMaxF = 290.0 ;-- y-axis max value
res@tmXBMode = "Manual" ;-- don't use default settings for tick marks
res@tmXBTickSpacingF = 30 ;-- x major tick mark spacing
res@tmXBMinorPerMajor = 2 ;-- set number of minor tick marks
res@tmXBLabelDeltaF = 0.15 ;-- move x-axis labels down
res@tmXBLabelFontHeightF = 0.012 ;-- decrease x-axis label font size
res@tiMainString = "DKRZ NCL Example: Daily Climatology" ;-- title string
res@tiXAxisString = x@units ;-- x-axis string
res@tiXAxisFontHeightF = 0.012 ;-- x-axis label font size
res@tiYAxisFontHeightF = 0.012 ;-- y-axis label font size
res@xyLineThicknesses = (/1.0, 2.0/) ;-- make 2nd lines thicker
res@xyLineColors = (/"blue","red"/) ;-- change line color
res@xyMonoDashPattern = True ;-- all solid
res@xyMarkLineModes = "Lines" ;-- line mode
;-- create the plot
plot = gsn_csm_y(wks,data,res)
end
Result: