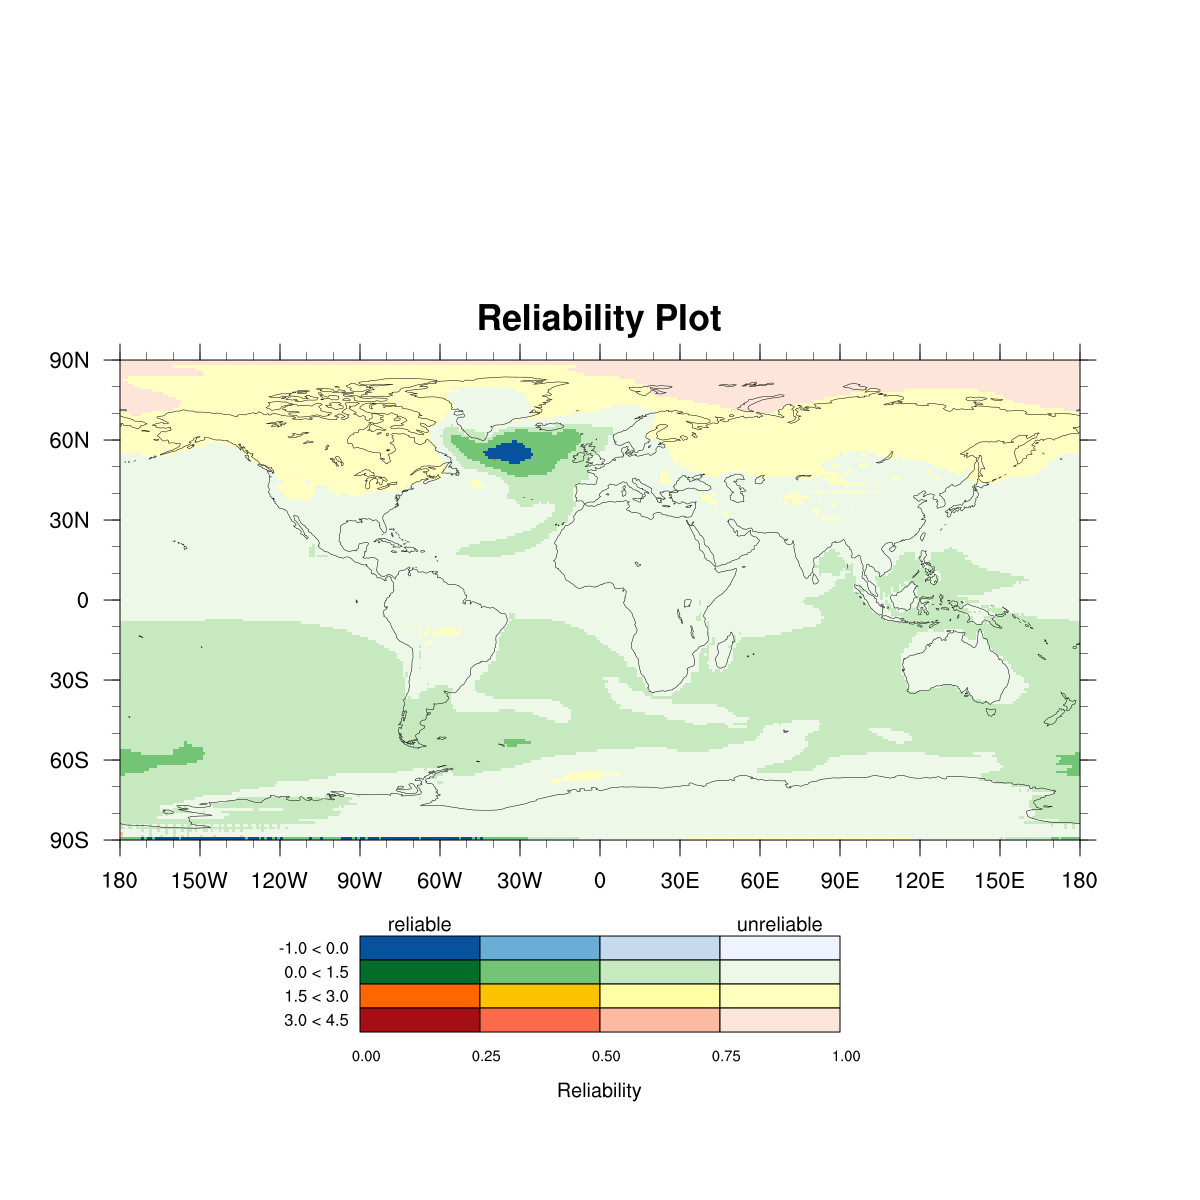
DKRZ NCL - Draw a common labelbar for 4 overlayed plots using 4 rows by 4 columns#
Source code:
;--------------------------------------------------------------------
; DKRZ NCL Example: labelbar_for_reliability_0.25.ncl
;
; Description: Create a labelbar for small data intervalls and
; different reliabilities displayed by increasing
; color brightness.
;--------------------------------------------------------------------
; function add_quad_labelbar
; create a labelbar with 4 lines and 4 columns
;--------------------------------------------------------------------
undef("add_quad_labelbar")
procedure add_quad_labelbar(wks:graphic,plot:graphic,colors:float,levels:numeric,intervals:string,nboxes:numeric,res:logical)
begin
nlevels = dimsizes(levels) ;-- number of levels
labels = ""+levels ;-- convert levels to strings
getvalues plot ;-- retrieve values from given plot
"vpWidthF" : vpw
"vpHeightF" : vph
"vpXF" : xf
"vpYF" : yf
end getvalues
width = vpw - 0.25 ;-- set width
height = 0.02 ;-- set height
dx = (width-0.15)/nboxes ;-- box width
dy = height ;-- box height
ddx = xf ;-- move labelbar to the right
ddy = yf - vph - 0.1 ;-- move labelbar upward
print("dx = "+dx+" dy = "+dy+" width = "+width+" ddx = "+ddx+" ddy = "+ddy)
;-- label bar box offset
offsetx = 0.3 ;-- box offset
offsety = 0.125 ;-- box offset
;-- box definition
boxx = (/0., dx, dx, 0., 0./) ;-- box corners
boxy = (/0., 0., dy, dy, 0./)
;-- polyline resources
plres = True
plres@gsLineColor = "black" ;-- change line color to black
plres@gsLineThicknessF = 2.0 ;-- increase line thickness
;-- polygon resources
pgres = True
pggres = True
;-- label text resources
txres = True
txres@txJust = "CenterRight"
txres@txFontHeightF = 0.009
txresI = txres
txresI@txFontHeightF = 0.010
txresT = True
txresT@txJust = "CenterCenter"
txresT@txFontHeightF = 0.012
;-- loop over number of color boxes
icol = 0
y = 0.
do jl = 0,3
y = jl*height
do il = 0,nboxes-1
x = offsetx +(il*dx)
pgres@gsFillColor = colors(jl,il,:) ;-- change fill color for each box
gsn_polygon_ndc( wks, boxx+x, boxy+ddy-y, pgres) ;-- draw the clear color boxes
gsn_polyline_ndc(wks, boxx+x, boxy+ddy-y, plres) ;-- draw the clear color boxes
end do
gsn_text_ndc(wks,intervals(jl),boxx(0)+offsetx-0.01,boxy(0)+ddy-y+(dy/2),txresI) ;-- draw the labels
end do
;-- draw labels
do i=0,nboxes
x = offsetx +(i*dx)
dc = dx/3
gsn_text_ndc(wks,sprintf("%3.2f",levels(i)),x+(dx/2)-dc,boxy(0)+ddy-(height*4),txres) ;-- draw the labels
end do
;-- draw labelbar annotations
gsn_text_ndc(wks,"reliable", offsetx + dx/2, boxy(0)+ddy+height*2-0.01, txresT) ;-- draw the labels
gsn_text_ndc(wks,"unreliable", offsetx + nboxes*dx - dx/2, boxy(0)+ddy+height*2-0.01,txresT) ;-- draw the labels
gsn_text_ndc(wks,"Reliability",offsetx + (nboxes/2)*dx,boxy(0)+ddy-(height*5)-0.01,txresT) ;-- draw the labels
end
;----------
; MAIN
;----------
begin
;-- open data files and read the variables
diri = "$HOME/NCL/Uncertainty/IPCC/data/"
fili1 = "tas-degC_T2Ms_rcp26_mmm-diff_1x1_mean2081-2099.nc"
vname1 = "tas-degC"
f1 = addfile(diri+fili1,"r")
var = f1->$vname1$(0,:,:)
lat = f1->lat
lon = f1->lon
fili2 = "tas-degC_T2Ms_rcp26_mmm-frac_1x1_mean2081-2099.nc"
vname2 = "tas-degC-frac"
f2 = addfile(diri+fili2,"r")
rel = f2->$vname2$(0,:,:)
rel = lonFlip(rel)
;-- define the variable intervals and levels
intervals = (/"-1.0 < 0.0","0.0 < 1.5","1.5 < 3.0","3.0 < 4.5"/)
levels = fspan(0.0,1.0,5)
;-- select data within values ranges
var0 = where(var .ge. -1.0 .and. var .lt. 0.0, var, var@_FillValue)
var1 = where(var .ge. 0.0 .and. var .lt. 1.5, var, var@_FillValue)
var2 = where(var .ge. 1.5 .and. var .lt. 3.0, var, var@_FillValue)
var3 = where(var .ge. 3.0 .and. var .lt. 4.5, var, var@_FillValue)
var_all = (/var0,var1,var2,var3/)
printVarSummary(var_all)
;-- reliability: convert 2d to 1d array
rel1d = ndtooned(rel)
dims = dimsizes(rel)
;-- reliability: retrieve the indices for value ranges and convert back to 2d
ind0 = ind_resolve(ind(rel1d .ge. 0.00 .and. rel1d .lt. 0.25), dims)
ind1 = ind_resolve(ind(rel1d .ge. 0.25 .and. rel1d .lt. 0.50), dims)
ind2 = ind_resolve(ind(rel1d .ge. 0.50 .and. rel1d .lt. 0.75), dims)
ind3 = ind_resolve(ind(rel1d .ge. 0.75 .and. rel1d .lt. 1.00), dims)
ind4 = ind_resolve(ind(rel1d .ge. 1.00), dims)
;-- set data ranges to values
do i = 0,3
if(.not. any(ismissing(ind0))) then
var_all(i,ind0(0,0),ind0(0,1)) = 0.00
end if
if(.not. any(ismissing(ind1))) then
var_all(i,ind1(0,0),ind1(0,1)) = 0.25
end if
if(.not. any(ismissing(ind2))) then
var_all(i,ind2(0,0),ind2(0,1)) = 0.5
end if
if(.not. any(ismissing(ind3))) then
var_all(i,ind3(0,0),ind3(0,1)) = 0.75
end if
if(.not. any(ismissing(ind4))) then
var_all(i,ind4(0,0),ind4(0,1)) = 1.0
end if
end do
;-- complete variable definition with coordinates
var_all!0 = "interval"
var_all!1 = "lat"
var_all!2 = "lon"
var_all&lat = lat
var_all&lon = lon
var_all&lat@units = "degrees_north"
var_all&lon@units = "degrees_east"
;-- choose color maps, 6 colors
cmapdir = "$HOME/NCL/Colors/"
color1 = read_colormap_file(cmapdir+"Blues_6.rgba")
color2 = read_colormap_file(cmapdir+"Greens_6.rgba")
color3 = read_colormap_file(cmapdir+"GMT_Yellow_6.rgba")
color4 = read_colormap_file(cmapdir+"Reds_6.rgba")
;-- reverse the colormaps and use only 4 colors
cind = (/5,3,1,0/)
color1 := color1(cind,:)
color2 := color2(cind,:)
color3 := color3(cind,:)
color4 := color4(cind,:)
ncol = dimsizes(color1(:,0))
colors = (/color1,color2,color3,color4/)
;-- open workstation
wks_type = "png"
wks_type@wkWidth = 1200
wks_type@wkHeight = 1200
wks = gsn_open_wks(wks_type,"plot_labelbar_reliability_0.25")
;-- set resources
res = True
res@gsnDraw = False
res@gsnFrame = False
res@cnFillOn = True
res@cnFillMode = "RasterFill"
res@cnLinesOn = False
res@cnLineLabelsOn = False
res@cnInfoLabelOn = False
res@cnLevelSelectionMode = "ManualLevels"
res@cnMinLevelValF = 0.0
res@cnMaxLevelValF = 1.0
res@cnLevelSpacingF = 0.2
res@lbLabelBarOn = False ;-- don't draw a labelbar
res@tiMainString = "Reliability Plot"
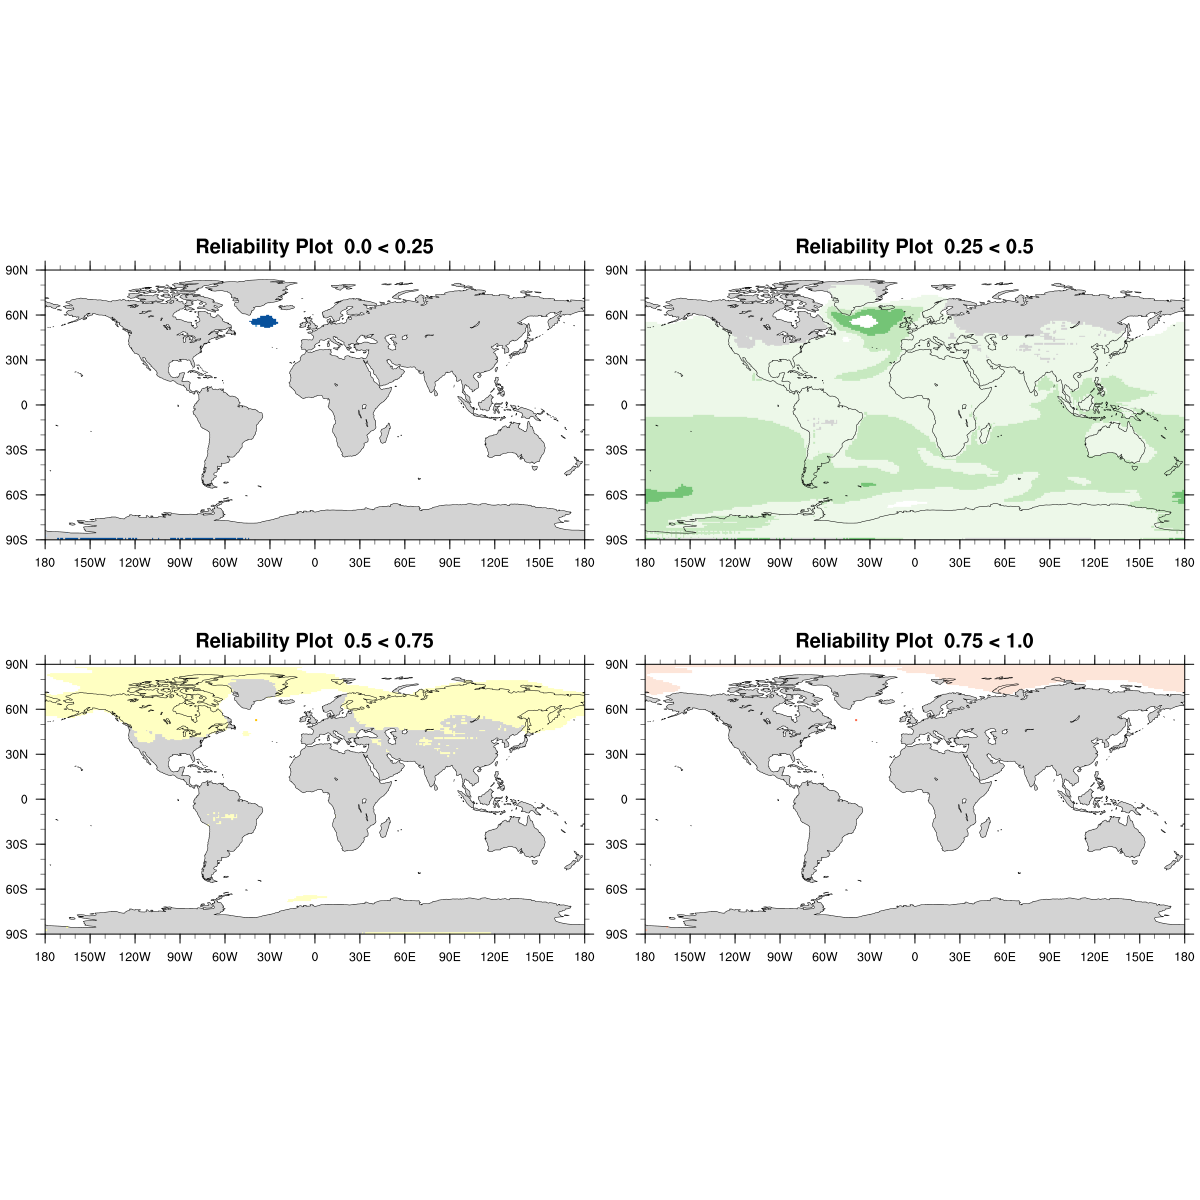
;-- create the 4 plots for panel overview and 4 plots to be combined (overlay)
res@cnFillPalette := color1
plot0 = gsn_csm_contour_map(wks,var_all(0,:,:),res)
res@tiMainString = "Reliability Plot 0.0 < 0.25"
plot0m = gsn_csm_contour_map(wks,var_all(0,:,:),res)
res@cnFillPalette := color2
plot1 = gsn_csm_contour(wks,var_all(1,:,:),res)
res@tiMainString = "Reliability Plot 0.25 < 0.5"
plot1m = gsn_csm_contour_map(wks,var_all(1,:,:),res)
res@cnFillPalette := color3
plot2 = gsn_csm_contour(wks,var_all(2,:,:),res)
res@tiMainString = "Reliability Plot 0.5 < 0.75"
plot2m = gsn_csm_contour_map(wks,var_all(2,:,:),res)
res@cnFillPalette := color4
plot3 = gsn_csm_contour(wks,var_all(3,:,:),res)
res@tiMainString = "Reliability Plot 0.75 < 1.0"
plot3m = gsn_csm_contour_map(wks,var_all(3,:,:),res)
;-- create panel overview plot
panelres = True
panelres@gsnPanelYWhiteSpacePercent = 10
gsn_panel(wks,(/plot0m,plot1m,plot2m,plot3m/),(/2,2/),panelres)
;-- overlay plots
overlay(plot0,plot1)
overlay(plot0,plot2)
overlay(plot0,plot3)
draw(plot0)
;-- add the multi-line labelbar
add_quad_labelbar(wks,plot0,colors,levels,intervals,ncol,res)
;-- advance the frame
frame(wks)
end
Result: