DKRZ NCL EUMETSAT IASI swath data example#
Example script:
;-------------------------------------------------------------------------
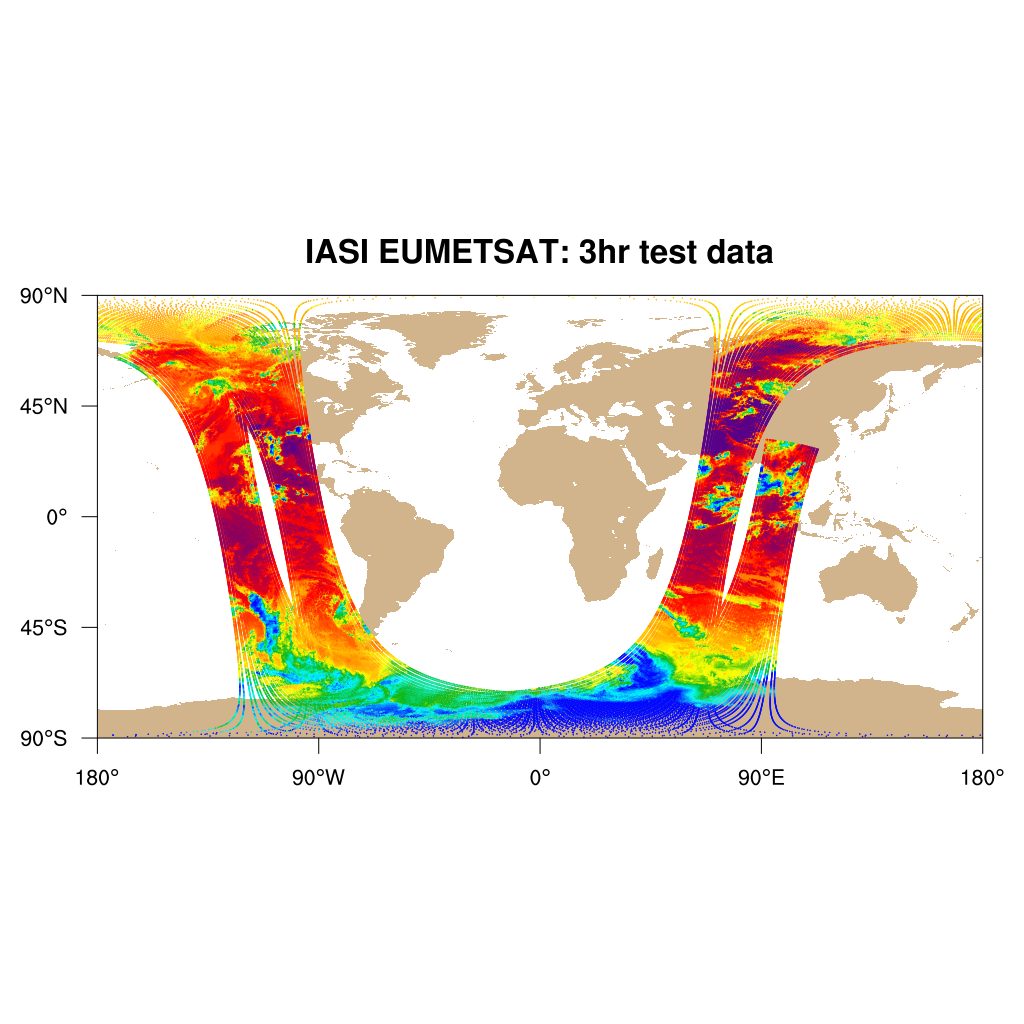
; Plot IASI EUMETSAT original data
;
; Data: Satellite swath 3hr data (unstructured)
;
; dimensions:
; nMeas = 162417 ;
; nInstr = 1 ;
; nSens = 1 ;
; nChannel = 5 ;
; nAction = 19 ;
; nTest = 15 ;
; StringLen = 109 ;
; variables:
; float LAT(nMeas) ;
; LAT:long_name = "LATITUDE (HIGH ACCURACY)" ;
; LAT:units = "DEGREE" ;
; LAT:codetable = 5001 ;
; LAT:_FillValue_0 = 9.96921e+36f ;
; float LON(nMeas) ;
; LON:long_name = "LONGITUDE (HIGH ACCURACY)" ;
; LON:units = "DEGREE" ;
; LON:codetable = 6001 ;
; LON:_FillValue_0 = 9.96921e+36f ;
; float BT_OBS(nMeas, nChannel) ;
; BT_OBS:long_name = "Observed brightness temperature" ;
; BT_OBS:units = "K" ;
; BT_OBS:codetable = 12063 ;
; BT_OBS:_FillValue = 9.96921e+36f ;
;
;
; Plot type: polymarkers
;
; 04.02.16 kmf
;-------------------------------------------------------------------------
begin
st = get_cpu_time() ;-- for calculating the elapsed CPU time
diri = "$HOME/data/EUMETSAT/IASI/"
odir = "./"
fili = "IASI_004_200907170300-200907170600.nc"
pltname = "plot_IASI_EUMETSAT_original_data_markers"
chan = 2
;-- read the data from new netCDF file
f = addfile(diri+fili,"r")
var = f->BT_OBS(:,chan)
lat = f->LAT
lon = f->LON
;-- open a workstation
wks = gsn_open_wks("png",odir+"/"+pltname)
;-- assign and retrieve color map
gsn_define_colormap(wks,"BlAqGrYeOrReVi200")
cmap = gsn_retrieve_colormap(wks)
;-- define value levels
levels = ispan(220,300,2)*1.
nlevels = dimsizes(levels)
;-- define color array
colors = span_color_indexes(cmap(3:,:),dimsizes(levels)+1) + 3
;-- set map resources
mpres = True
mpres@gsnMaximize = True ;-- maximize size of plot in window
mpres@gsnDraw = False ;-- turn off draw
mpres@gsnFrame = False ;-- turn off page advance
mpres@mpMinLatF = -90.
mpres@mpMaxLatF = 90.
mpres@mpMinLonF = -180.
mpres@mpMaxLonF = 180.
mpres@mpDataBaseVersion = "MediumRes" ;-- better map resolution
mpres@mpLandFillColor = "tan"
mpres@tiMainString = "IASI EUMETSAT: 3hr test data"
mpres@pmTickMarkDisplayMode = "Always" ;-- nicer map tickmarks
;-- create the map
map = gsn_csm_map(wks,mpres)
;-- group the variable values according to which range they fall
;-- in, and attach them to the map as a colored marker
mkres = True
mkres@gsMarkerIndex = 16 ;-- filled dot
mkres@gsMarkerSizeF = 0.001
markerid = new(nlevels+1,graphic)
do i=0,nlevels
if(i.eq.0) then ;-- first level
ii := ind(var.lt.levels(0))
else if(i.eq.nlevels) then ;-- middle levels
ii := ind(var.ge.levels(nlevels-1))
else ;-- last level
ii := ind(var.ge.levels(i-1).and.var.lt.levels(i))
end if
end if
if(.not.any(ismissing(ii))) then
mkres@gsMarkerColor = colors(i)
markerid(i) = gsn_add_polymarker(wks,map,lon(ii),lat(ii),mkres)
end if
end do
;-- draw map and the attached markers
draw(map)
frame(wks)
;-- calculate and print elapsed wall clock time
et = get_cpu_time()
print(" --> Used CPU time: "+ (et-st) + " seconds")
end
Result: