DKRZ NCL example area weighted y-axis (latitude) annotation#
Example script:
;-------------------------------------------------------------------
; DKRZ NCL example: irregular_axis_labels_dummy_data.ncl
;
; Description: Irregular y-axis labels depending on the
; grid area of the latitudes (sinus(lat*PI/180.).
;
; 14.01.19 kmf
;-------------------------------------------------------------------
;-- global variables
PI = get_pi("float")
;-----------------------------------------------------------
; Procedure draw_y_axis_annotation
; Annotate the left y-axis irregularly depending of
; the area grid sizes.
;-----------------------------------------------------------
undef("draw_y_axis_annotation")
procedure draw_y_axis_annotation(wks,plot,yval)
begin
getvalues plot ;-- retrieve viewport settings of plot
"vpWidthF" : vpw
"vpHeightF" : vph
"vpXF" : vpx
"vpYF" : vpy
end getvalues
ylabels = yval + "" ;-- convert yval to type string
siny = sin(yval*PI/180.) ;-- compute sinus values
ny = dimsizes(yval) ;-- dimension of yval
;-- format the ylabels from -90.-90. to 90S-90N; 0. degrees labeled EQ
do k=0,ny-1
if(yval(k) .gt. 0. .and. yval(k).ne. 80.) then
ylabels(k) = sprintf("%4.1fN",yval(k))
elseif(yval(k) .eq. 0.) then ;-- write 'EQ' instead of 0.0
ylabels(k) = "EQ"
elseif(yval(k) .eq. 80.) then ;-- prevent overwriting of y-axis values
ylabels(k) = ""
elseif(yval(k) .eq. -80.) then ;-- prevent overwriting of y-axis values
ylabels(k) = ""
else
t = yval(k)*-1.
ylabels(k) = sprintf("%4.1fS",t)
end if
end do
;-- polyline resources
plres = True
plres@gsLineThicknessF = 2 ;-- line thickness for tickmarks
;-- text resources
txres = True
txres@txFontHeightF = 0.014 ;-- y-axis labels: default size is HUGE!
txres@txJust = "CenterLeft" ;-- y-axis labels: alignment
txres1 = txres
txres1@txFontHeightF = 0.018 ;-- y-axis title
txres1@txJust = "CenterCenter" ;-- y-axis labels: alignment
txres1@txAngleF = 90. ;-- rotate text string 90 degrees
;-- compute tickmark locations and add tickmarks and labels to plot
do i=0,ny-1
if(i .eq. 0) then
y = vpy-vph
else
y = (siny(i)*vph/2) + (vpy-vph/2)
end if
gsn_polyline_ndc(wks, (/vpx-0.01,vpx/), (/y,y/), plres) ;-- left y-axis tickmarks
gsn_polyline_ndc(wks, (/vpx+vpw,vpx+vpw+0.01/), (/y,y/), plres) ;-- right y-axis tickmarks
gsn_text_ndc(wks, ylabels(i), vpx-0.07, y, txres) ;-- left y-axis labels
end do
gsn_text_ndc(wks, "latitudes", vpx-0.09, vpy-vph/2, txres1) ;-- left y-axis labels
end ;-- end function 'draw_y_axis_annotation'
;++++++++++++++++++++++++++++++++++++++++++++++
; MAIN
;++++++++++++++++++++++++++++++++++++++++++++++
begin
;-- generate dummy data
y = ispan(-90,90,1)*1.
y@standard_name = "latitudes"
x = cos(0.050*y)
x@standard_name = "data"
;-- open workstation
wks = gsn_open_wks ("png","plot_irregular_axis_labels_dummy_data")
;-- set resources
res = True
res@gsnMaximize = True ;-- maximize graphics output
res@xyMonoDashPattern = True ;-- use same dash pattern for all lines
res@xyDashPattern = 0 ;-- use solid dash pattern
res@xyLineColor = "blue" ;-- set line colors
res@xyLineThicknessF = 3 ;-- set line thickness
res@gsnYRefLine = 0 ;-- where to draw the reference line
res@gsnXRefLine = 0 ;-- where to draw the reference line
res@gsnXRefLineDashPattern = 2 ;-- x reference line dash pattern
res@gsnYRefLineDashPattern = 2 ;-- y reference line dash pattern
res@trXMinF = -1.1 ;-- set x-axis minimum
res@trXMaxF = 1.1 ;-- set x-axis maximum
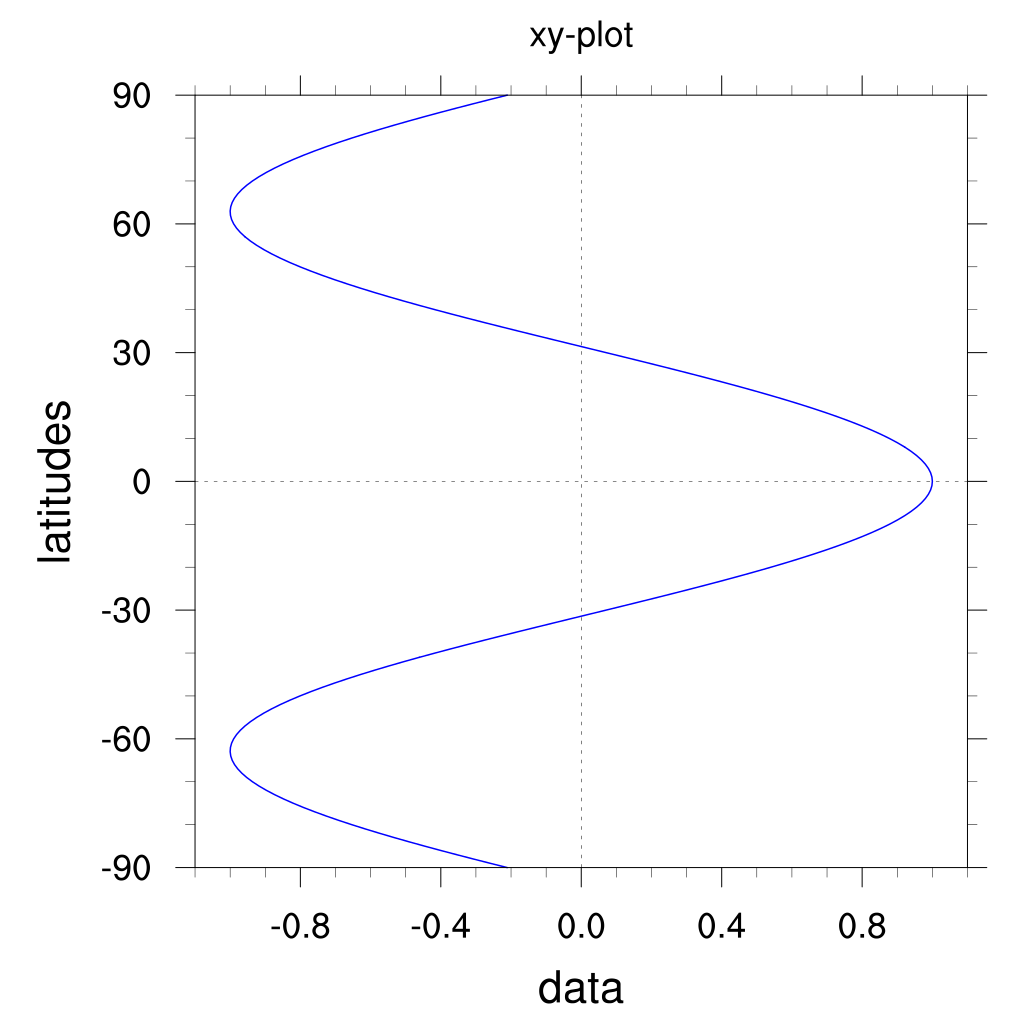
res@tiMainFontHeightF = 0.02 ;-- main title font size
res@tiMainString = "xy-plot" ;-- title
;-- create the base data plot without grid area dependency
base = gsn_csm_xy(wks,x,y,res)
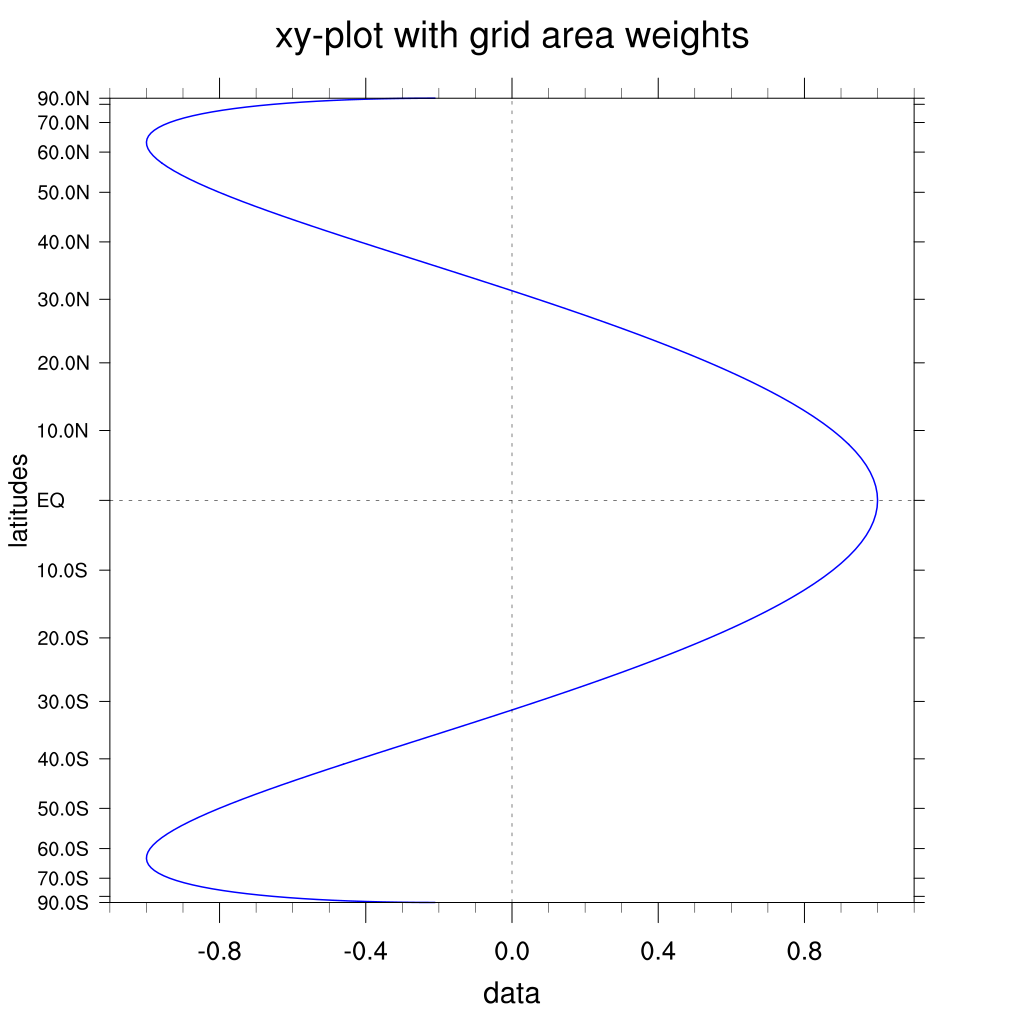
;---------------------------------------------------------------------------
;-- compute the area weighted y-values using sinus function
;---------------------------------------------------------------------------
yvalues = sin(tofloat(y)*PI/180.) ;-- values at y-axis of unit circle
;-- set resources
res@gsnDraw = False ;-- don't draw the plot, yet
res@gsnFrame = False ;-- don't advance the frame, yet
res@trYMinF = -1.0 ;-- needed if we use the 2nd way (sinus)
res@trYMaxF = 1.0 ;-- needed if we use the 2nd way (sinus)
res@tmYLOn = False ;-- don't draw left y-axis tickmarks and labels
res@tmYROn = False ;-- don't draw right y-axis tickmarks and labels
res@tmXBLabelFontHeightF = 0.014 ;-- x-axis labels: default size is HUGE!
res@tiMainString = "xy-plot with grid area weights" ;-- title
res@tiXAxisFontHeightF = 0.016 ;-- x-axis title font size
;-- create the data plot with grid area dependency (sin(lat*PI/180))
plot = gsn_csm_xy(wks,x,yvalues,res)
draw(plot) ;-- draw the plot
;-- add y-axis labels and tickmarks
yaxis_values = fspan(-90.,90.,19) ;-- -90.-90. every 10th degree
draw_y_axis_annotation(wks,plot,yaxis_values) ;-- call procedure to add y-axis labels and tickmarks
;-- advance the frame
frame(wks)
end
Result: