DKRZ NCL example attached plots among others#
Example script:
;-------------------------------------------------------
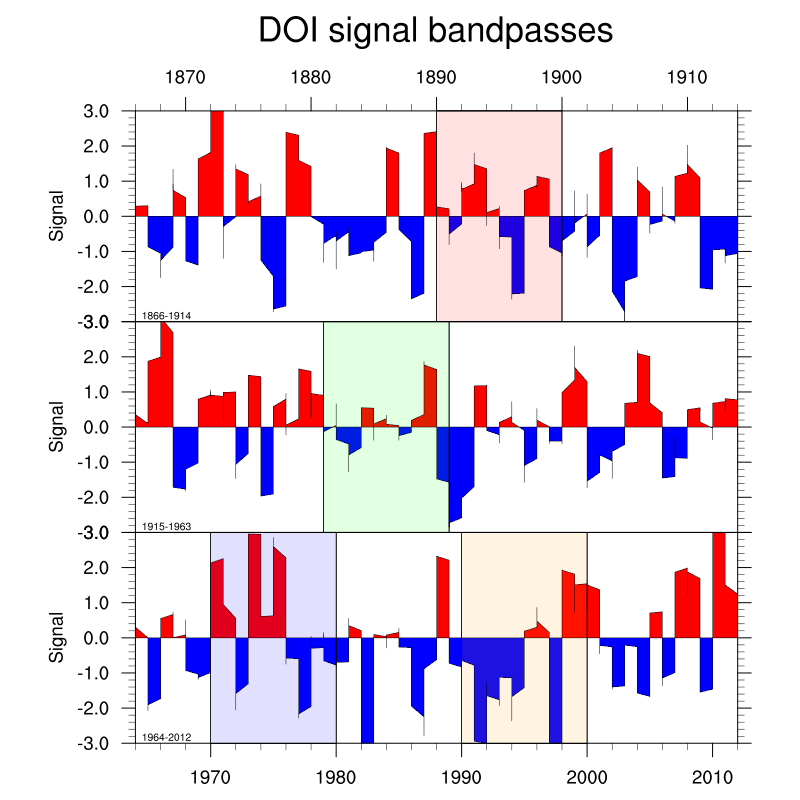
; DKRZ NCL Example script: attach_long_timeseries.ncl
;
; Description: - split long time series data into
; 3 parts and plot it among each other
; - draw mark bars at given 10 years values
;
; Special: usn gsn_attach_plots function
;
; 23.06.17 kmf
;-------------------------------------------------------
begin
f = addfile ("$HOME/NCL/data/SOI.nc" , "r") ;-- SOI.nc is an NCL example data file
var = f->SOI_SIGNAL_LOWPASS
date = f->yyyymm
ntimes = dimsizes(date)
;-- 1764/3 = 588 , split into 3 time-parts which should be plotted among each other
dt3 = ntimes/3
time_1 = date(:dt3-1)/100 ;-- first time line
time_2 = date(dt3:(2*dt3-1))/100 ;-- second time line
time_3 = date((2*dt3):)/100 ;-- third time line
yyyy = date/100 ;-- all years
var_1 = var(:dt3-1) ;-- data first time line
var_2 = var(dt3:(2*dt3-1)) ;-- data second time line
var_3 = var((2*dt3):) ;-- data third time line
;-- open workstation
wks = gsn_open_wks ("png","plot_attached_long_timeseries") ;-- send graphics to PNG file
;-- resources
res = True ;-- plot mods desired
res@gsnDraw = False
res@gsnFrame = False ;-- don't advance frame yet
res@vpHeightF = 0.28 ;-- change aspect ratio of plot
res@vpWidthF = 0.8
res@vpXF = 0.07 ;-- start plot at x ndc coord
res@trYMinF = -3.0 ;-- min value on y-axis
res@trYMaxF = 3.0 ;-- max value on y-axis
res@tiYAxisString = "Signal" ;-- y-axis label
res@tiMainString = "DOI signal bandpasses" ;-- title
res@gsnYRefLine = 0.0 ;-- create a reference line
res@gsnAboveYRefLineColor = "red" ;-- above ref line fill red
res@gsnBelowYRefLineColor = "blue" ;-- below ref line fill blue
res@xyCurveDrawOrder = "PostDraw" ;-- draw any attached primitives
res@tfPolyDrawOrder = "PreDraw" ;-- draw any attached primitives before plot
;-- text resources
txres = True
txres@txFontHeightF = 0.01 ;-- small font size
;-- create the plot
plot = new(3,graphic) ;-- assign plot array
nplots = dimsizes(plot) ;-- number of plots
res@tmXBOn = False ;-- don't draw bottom x-axis
res@tmXTOn = True ;-- draw top x-axis
res@tmXTLabelsOn = True ;-- draw top x-axis labels
plot(0) = gsn_csm_xy (wks,time_1,var_1,res) ;-- create plot 1 - upper
res@tmXBOn = True ;-- draw bottom x-axis
res@tmXTOn = False ;-- don't draw top x-axis
res@tmXTLabelsOn = False ;-- don't draw top x-axis labels
plot(1) = gsn_csm_xy (wks,time_2,var_2,res) ;-- create plot 2 - middle
plot(2) = gsn_csm_xy (wks,time_3,var_3,res) ;-- create plot 3 - lower
;-- add text to each plot
txid1 = gsn_add_text(wks,plot(0),min(time_1)+"-"+max(time_1),min(time_1)+2.5,res@trYMinF+0.17,txres)
txid2 = gsn_add_text(wks,plot(1),min(time_2)+"-"+max(time_2),min(time_2)+2.5,res@trYMinF+0.17,txres)
txid3 = gsn_add_text(wks,plot(2),min(time_3)+"-"+max(time_3),min(time_3)+2.5,res@trYMinF+0.17,txres)
;-- set up arrays to hold bar coordinates
ymin = res@trYMinF ;-- y-axis minimum
ymax = res@trYMaxF ;-- y-axis maximum
ybars = (/ymin, ymin, ymax, ymax, ymin/)
xwdt = 10 ;-- how many years should be marked
xmin = (/1890,1930,1970,1990/) ;-- which years should be marked
xmax = xmin + xwdt
nsecs = dimsizes(xmin) ;-- number of mark bars
colors = (/"red","green","blue","orange"/) ;-- colors of mark bars
;-- polyline/polygon resources
plres = True
plres@gsLineColor = "black" ;-- polyline color
plres@gsFillOpacityF = 0.02 ;-- nearly transparent
plres@tfPolyDrawOrder = "PreDraw" ;-- draw any attached primitives first
;-- check in which plot the mark bar has to be plotted
do i=0,nplots-1
do j=0,nsecs-1
xbars = (/xmin(j), xmax(j), xmax(j), xmin(j), xmin(j)/)
if(.not. ismissing(any(ind(xmin(j) .eq. time_1)))) then
use_plot = plot(0)
else if (.not. ismissing(any(ind(xmin(j) .eq. time_2)))) then
use_plot = plot(1)
else if (.not. ismissing(any(ind(xmin(j) .eq. time_3)))) then
use_plot = plot(2)
end if
end if
end if
plres@gsFillColor = colors(j) ;-- mark bar color
polyg = unique_string("polyg") ;-- unique string
plot@$polyg$ = gsn_add_polygon(wks,use_plot,xbars,ybars,plres) ;-- draw polygon
polyl = unique_string("polyl") ;-- unique string
plot@$polyl$ = gsn_add_polyline(wks,use_plot,xbars,ybars,plres) ;-- draw polyline
end do
end do
;-- attach plots along the x-axes
attres1 = True
attres1@gsnAttachPlotsXAxis = True ;-- attaches along x-axis
attres2 = True
attres2@gsnAttachPlotsXAxis = True ;-- attaches along x-axis
attid1 = gsn_attach_plots(plot(0),plot(1:2),attres1,attres2)
;-- maximize output on the page and draw everything
maximize_output(wks,False) ;-- maximize plot on page
end
Result: