DKRZ NCL Example masked data by shapefile#
Example script:
;--------------------------------------------------------------------
; DKRZ NCL Example: mask_data_by_shapefile.ncl
;
; Description: use a shapefile to mask your data
;
; Shapefile: DEU_adm1.shp downloaded from
;
; http://www.gadm.oarg/country/Germany
;
; You have to download the shapefile_utils.ncl file from:
;
; https://www.ncl.ucar.edu/Applications/Scripts/shapefile_utils.ncl
;
; 13.07.18 kmf
;--------------------------------------------------------------------
load "./shapefile_utils.ncl" ;-- down load the file and save it in current dir
begin
;-- shapefile name
shp_filename = "$HOME/data/Shapefiles/DEU_adm/DEU_adm1.shp"
;-- open file and read variable
f = addfile("$HOME/data/CMIP5/atmos/tas_day_MPI-ESM-LR_rcp45_r1i1p1_20060101-20091231_0.1deg.nc","r")
var = f->tas(0,:,:)
;-- define sub-region, here for Germany
minlat = 46.8
maxlat = 55.3
minlon = 6.0
maxlon = 15.5
;-- open workstation
wks_type = "png"
wks_type@wkWidth = 1200
wks_type@wkHeight = 1200
wks = gsn_open_wks(wks_type,"plot_shapefiles_masking")
;-- resource settings
res = True
res@gsnDraw = False ;-- don't draw plot yet
res@gsnFrame = False ;-- don't advance frame yet
res@gsnMaximize = True ;-- maximize plot in frame
res@cnFillOn = True
res@cnLinesOn = False
res@cnLineLabelsOn = False
res@cnFillPalette = "BlueYellowRed"
res@cnLevelSelectionMode = "ManualLevels" ;-- manually set contour levels
res@cnMinLevelValF = 260.0 ;-- contour min lev
res@cnMaxLevelValF = 280.0 ;-- contour max lev
res@cnLevelSpacingF = 0.5 ;-- contour spacing
res@mpDataBaseVersion = "HighRes" ;-- use HighRes map
res@mpDataResolution = "Fine" ;-- we need a finer resolution
res@mpProjection = "Mercator" ;-- use Mercator projection
res@mpLimitMode = "Corners" ;-- map limit mode
res@mpLeftCornerLatF = minlat+0.5 ;-- min lat
res@mpRightCornerLatF = maxlat-0.5 ;-- max lat
res@mpLeftCornerLonF = minlon-0.5 ;-- min lon
res@mpRightCornerLonF = maxlon+0.5 ;-- max lon
res@mpCenterLatF = ((minlat+maxlat)*0.5)-5.0
res@mpCenterLonF = ((minlon+maxlon)*0.5)-5.0
res@mpGridLineColor = "grey40"
res@mpFillOn = True
res@mpOutlineOn = True
res@mpGeophysicalLineColor = "black"
res@mpOceanFillColor = (/ 0.824, 0.961, 1.0 /)
res@mpInlandWaterFillColor = (/ 0.824, 0.961, 1.0 /)
res@mpLandFillColor = (/ 0.7, 0.7, 0.7 /)
res@lbBoxMinorExtentF = 0.16 ;-- decrease height of labelbar boxes
res@pmLabelBarOrthogonalPosF = -0.08 ;-- move labelbar to the left side of plot res@lbBoxMinorExtentF = 0.2 ;-- decrease height of labelbar boxes
res@pmTickMarkDisplayMode = "Always"
res@tmXTOn = False
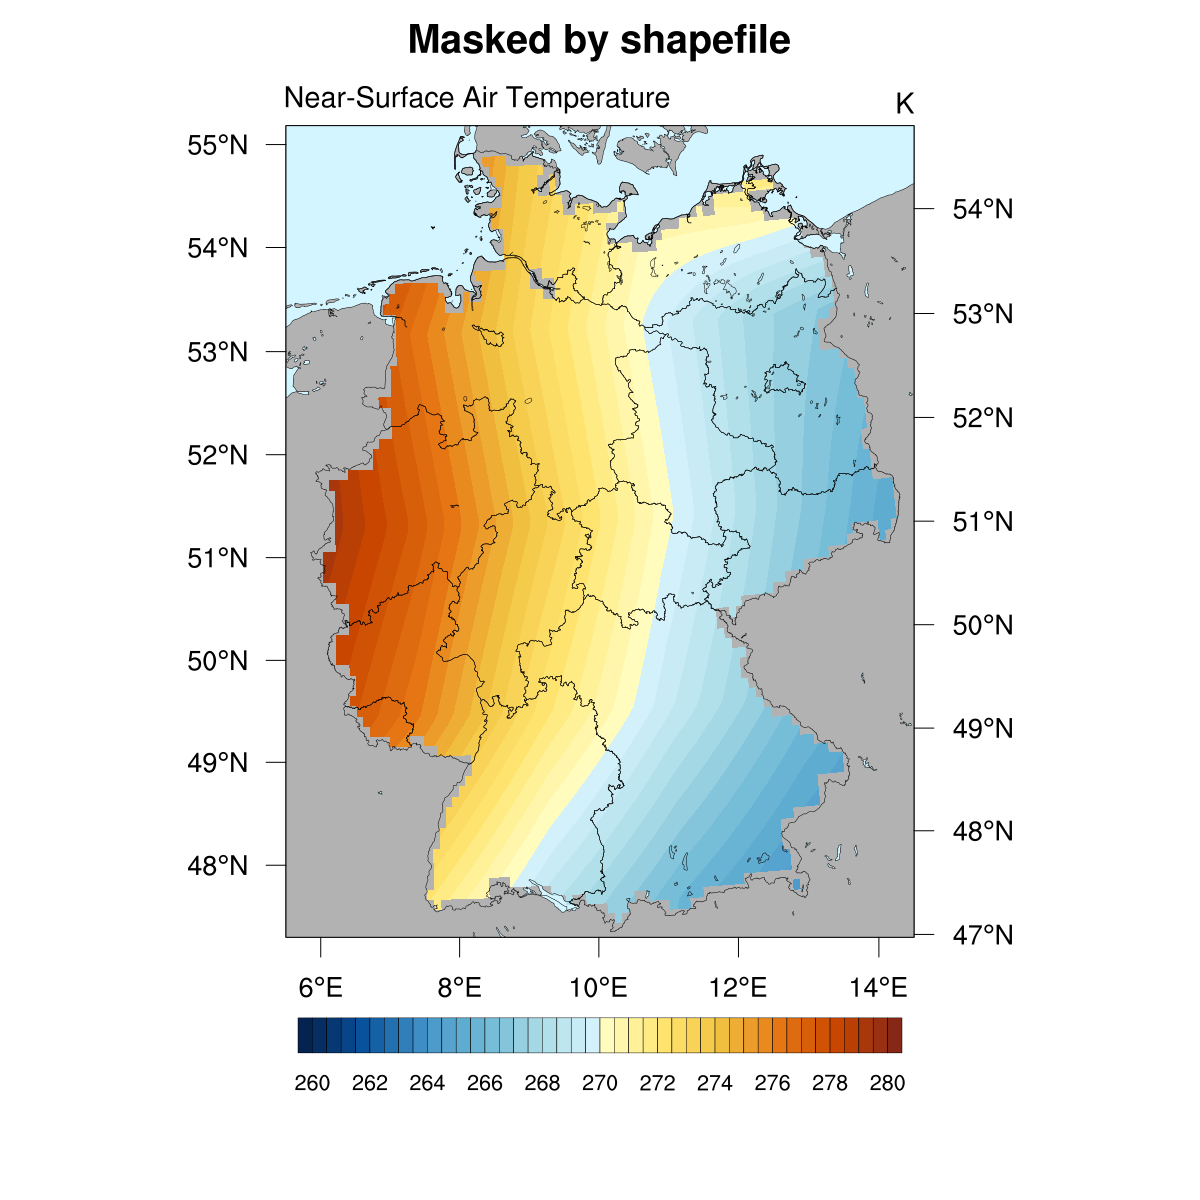
res@tiMainString = "Masked by shapefile"
;-- create plot
plot = gsn_csm_contour_map(wks,var,res)
;-- use shapefile to mask these dummy arrays based on shapefile outline
var_mask = shapefile_mask_data(var,shp_filename,True)
;-- create contours of masked data
plot_mask = gsn_csm_contour_map(wks,var_mask,res)
;-- add plot_mask to plot
lnres = True
lnres@gsLineColor = "black"
lnres@gsLineThicknessF = 1.0
plot@lines = gsn_add_shapefile_polylines(wks, plot_mask, shp_filename, lnres)
;-- draw the plot and advance the frame
draw(plot_mask)
frame(wks)
end
Result: