DKRZ NCL example rotated grid: mask data by shapefile content (selected provinces)#
Example script:
/;
DKRZ NCL example:
REMO_T_CL_mask_data_by_shapefile_NAME_1.ncl
Description:
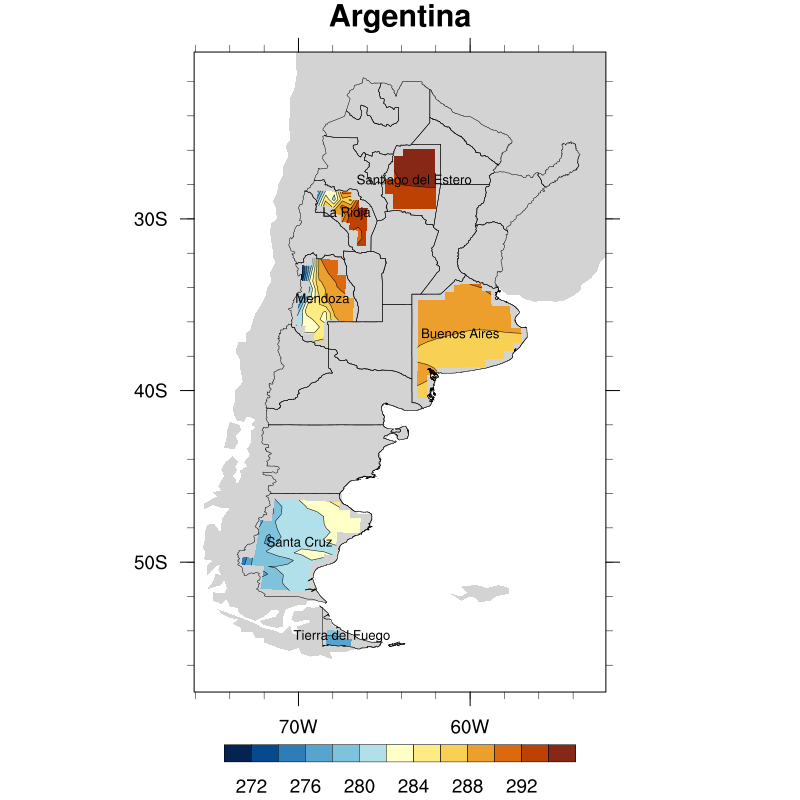
Read 2D-coordinates on a rotated grid and use a shapefile to mask the data
for selected provinces of Argentina. Add the names of the provinces to the map.
Shapefile:
Download the shapefile from www.gadm.org
gadm36_ARG_shp/gadm36_ARG_1.shp Argentina provinces
Based on NCL example:
http://ncl.ucar.edu/Applications/Scripts/shapefiles_5.ncl
Specials:
shapefile_utils.ncl contains functions for shapefiles and can be copied
from http://ncl.ucar.edu/Applications/Scripts/shapefile_utils.ncl.
The function shapefile_mask_data() is used to mask the data by a set of
selected states of the shapefile, in this case provinces of Argentina.
Known bug:
For rotated grids or named coordinates of curvilinear grids the function
shapefile_mask_data() is running into an error because the named
coordinates let it go into the part of rectilinear grids (bug). To prevent
running into this error you simply have to multiply the variable by 1. and
the names of the coordinates will be stripped off. ;-)
Author:
meier-fleischer(at)dkrz.de
Date:
26.03.2016
;/
;-- load shapefile functions library file
load "shapefile_utils.ncl"
;-----------------------------------------------------------------------------------------
; procedure calcPolygonAreaAndCentroid (from http://ncl.ucar.edu/Applications/Scripts/shapefiles_5.ncl)
;-----------------------------------------------------------------------------------------
undef("calcPolygonAreaAndCentroid")
function calcPolygonAreaAndCentroid(x, y, firstVert, lastVert)
local cY, cY, a, tmp
begin
cX = 0.d
cY = 0.d
area = 0.d
do i=firstVert,lastVert
if (i .eq. lastVert) then
j = firstVert
else
j = i + 1
end if
tmp = x(i)*y(j) - x(j)*y(i)
area = area + tmp
cX = cX + (x(i) + x(j))*tmp
cY = cY + (y(i) + y(j))*tmp
end do
area = area / 2.0
cX = cX / (6.0 * area)
cY = cY / (6.0 * area)
;-- recall that the area calculation may yield a negative result,
;-- depending upon CW vs. CCW ordering of the vertices
return (/abs(area), cX, cY/)
end
;-----------------------------------------------------------------------------------------
; procedure add_state_names (based on http://ncl.ucar.edu/Applications/Scripts/shapefiles_5.ncl)
;-----------------------------------------------------------------------------------------
undef("add_state_names")
procedure add_state_names(wks,plot,shpfile,shpvar,names,size)
local namlist,segsDims,geomDims,geom_segIndex,geom_numSegs,segs_xyzIndex,segs_numPnts, \
lines,numFeatures,labels,segNum,txres
begin
namlist = shpfile->$shpvar$
segsDims = dimsizes(shpfile->segments)
geomDims = dimsizes(shpfile->geometry)
;-- read global attributes
geom_segIndex = shpfile@geom_segIndex
geom_numSegs = shpfile@geom_numSegs
segs_xyzIndex = shpfile@segs_xyzIndex
segs_numPnts = shpfile@segs_numPnts
lines = new(segsDims(0), graphic) ;-- array to hold polygon edges
numFeatures = geomDims(0)
labels = new(numFeatures, graphic) ;-- array for region labels
segNum = 0
;-- text resources
txres = True
txres@gsTextJustification = 4 ;-- CenterCenter
txres@txFontColor = 1
txres@txFontHeightF = size
do feature=0,numFeatures-1
if(any(namlist(feature) .eq. names)) then ;-- add only the selected names to plot
startSegment = shpfile->geometry(feature, geom_segIndex)
numSegments = shpfile->geometry(feature, geom_numSegs)
centroidX = 0.d
centroidY = 0.d
area = -1.0d
do seg=startSegment,startSegment+numSegments-1
startPT = shpfile->segments(seg, segs_xyzIndex)
endPT = startPT + shpfile->segments(seg, segs_numPnts) - 1
segNum = segNum + 1
;-- find center-of-mass and area of this polygon
areaCenter = calcPolygonAreaAndCentroid(shpfile->x, shpfile->y, startPT, endPT)
if (areaCenter(0) .gt. area) then
area = areaCenter(0)
centroidX = areaCenter(1)
centroidY = areaCenter(2)
end if
end do
labels(feature) = gsn_add_text(wks, plot, shpfile->$shpvar$(feature), centroidX, centroidY, txres)
end if
end do
end
;-----------------------------------------------------------------------------------------
; MAIN
;-----------------------------------------------------------------------------------------
;-- open data file and read the variable
f = addfile("boden_southamerica_0440_t.nc","r")
var = f->T_CL(0,:,:) * 1. ;-- read variable and strip off the names of the coordinates
lat = f->lat
lon = f->lon
var@lat2d = lat ;-- tell NCL to use 2D coordinates
var@lon2d = lon ;-- tell NCL to use 2D coordinates
;-- which states/provinces shouldn't be masked
state_names = (/"Buenos Aires", "Santa Cruz", "Tierra del Fuego", "Santiago del Estero", \
"La Rioja", "Mendoza"/)
;-- shapefile name; downloaded from www.gadm.org
shpname = "gadm36_ARG_shp/gadm36_ARG_1.shp"
shpvar = "NAME_1"
shpf = addfile(shpname,"r") ;-- open the shapefile
;-- set sub-region
minlat = min(shpf->y) - 2.5
maxlat = max(shpf->y) + 1.5
minlon = min(shpf->x) - 2.5
maxlon = max(shpf->x) + 1.5
;-- graphics
wks = gsn_open_wks("png","plot_REMO_Argentina_mask_data_by_shapefile_1")
;-- create mask array
opt = True ;-- shapefile mask resources
opt@return_mask = True ;-- this forces the return of a 0s and 1s mask array
opt@debug = True ;-- show debugging information
opt@shape_var = shpvar ;-- shapefile variable
opt@shape_names = state_names ;-- what shouldn't be masked
mask_array = shapefile_mask_data(var,shpname,opt)
mask_array!0 = "y" ;-- add name coordinate lat
mask_array!1 = "x" ;-- add named coordinate lon
mask_array@lat2d = lat ;-- commit lat values
mask_array@lon2d = lon ;-- commit lon values
mask_array@coordinates = "lat lon"
;-- mask the data with the mask_array
mask_data = mask(var,mask_array,1) ;-- mask var by mask_array
mask_data!0 = "y" ;-- add name coordinate y
mask_data!1 = "x" ;-- add named coordinate x
mask_data@lat2d = lat ;-- commit lat values
mask_data@lon2d = lon ;-- commit lon values
mask_data@coordinates = "lat lon"
;-- masked contour plot
cnres = True
cnres@gsnDraw = False
cnres@gsnFrame = False
cnres@vpXF = 0.1
cnres@vpYF = 0.935
cnres@vpWidthF = 0.8
cnres@vpHeightF = 0.8
cnres@cnFillOn = True
cnres@cnFillPalette = "BlueYellowRed"
cnres@mpOutlineOn = False ;-- don't use NCL's map outlines
cnres@mpMinLatF = minlat
cnres@mpMaxLatF = maxlat
cnres@mpMinLonF = minlon
cnres@mpMaxLonF = maxlon
cnres@lbBoxMinorExtentF = 0.1 ;-- decrease the labelbar box height
cnres@pmLabelBarOrthogonalPosF = -0.03 ;-- move labelbar upward
cnres@tiMainString = "Argentina"
plot = gsn_csm_contour_map(wks,mask_data,cnres) ;-- create contour plot
;-- add shapefile polyline content
plres = True
plres@gsLineColor = "black"
pid = gsn_add_shapefile_polylines(wks,plot,shpname,plres)
;-- add the names of the selected states/provinces to plot
size = 0.012 ;-- font size
add_state_names(wks,plot,shpf,shpvar,state_names,size) ;-- add selected state/provinces
;-- draw the plot and advance the frame
draw(plot)
frame(wks)
Result: