DKRZ NCL example rotated grid: mask data by shapefile content (country borderline)#
Example script:
/;
DKRZ NCL example:
REMO_T_CL_mask_data_by_shapefile_NAME_0.ncl
Description:
Read 2D-coordinates on a rotated grid and use a shapefile to mask the data
for a selected region.
Shapefile:
Download the shapefile from www.gadm.org
gadm36_ARG_shp/gadm36_ARG_0.shp Argentina borderline
Based on NCL example:
http://ncl.ucar.edu/Applications/Scripts/shapefiles_5.ncl
Specials:
shapefile_utils.ncl contains functions for shapefiles and can be copied
from http://ncl.ucar.edu/Applications/Scripts/shapefile_utils.ncl.
The function shapefile_mask_data() is used to mask the data by a shapefile
containing the borderline of Argentina.
Known bug:
For rotated grids or named coordinates of curvilinear grids the function
shapefile_mask_data() is running into an error because the named
coordinates let it go into the part of rectilinear grids (bug). To prevent
running into this error you simply have to multiply the variable by 1. and
the names of the coordinates will be stripped off. ;-)
Author:
meier-fleischer(at)dkrz.de
Date:
26.03.2016
;/
;-- load shapefile functions library file
load "shapefile_utils.ncl"
;-- open data file and read the variable
f = addfile("boden_southamerica_0440_t.nc","r")
var = f->T_CL(0,:,:) * 1. ;-- read variable and strip off the names of the coordinates
lat = f->lat
lon = f->lon
var@lat2d = lat ;-- tell NCL to use 2D coordinates
var@lon2d = lon ;-- tell NCL to use 2D coordinates
;-- shapefile name; downloaded from www.gadm.org
shpname = "gadm36_ARG_shp/gadm36_ARG_0.shp"
shpvar = "NAME_0"
shpf = addfile(shpname,"r") ;-- open the shapefile
;-- set sub-region
minlat = min(shpf->y) - 2.5
maxlat = max(shpf->y) + 1.5
minlon = min(shpf->x) - 2.5
maxlon = max(shpf->x) + 1.5
;-- graphics
wks = gsn_open_wks("png","plot_REMO_Argentina_mask_data_by_shapefile_0")
;-- create mask array
opt = True ;-- shapefile mask resources
opt@return_mask = True ;-- this forces the return of a 0s and 1s mask array
opt@debug = True ;-- show debugging information
mask_array = shapefile_mask_data(var,shpname,opt)
mask_array!0 = "y" ;-- add name coordinate lat
mask_array!1 = "x" ;-- add named coordinate lon
mask_array@lat2d = lat ;-- commit lat values
mask_array@lon2d = lon ;-- commit lon values
mask_array@coordinates = "lat lon"
;-- mask the data with the mask_array
mask_data = mask(var,mask_array,1) ;-- mask var by mask_array
mask_data!0 = "y" ;-- add name coordinate y
mask_data!1 = "x" ;-- add named coordinate x
mask_data@lat2d = lat ;-- commit lat values
mask_data@lon2d = lon ;-- commit lon values
mask_data@coordinates = "lat lon"
;-- masked contour plot
cnres = True
cnres@gsnDraw = False
cnres@gsnFrame = False
cnres@vpXF = 0.1
cnres@vpYF = 0.935
cnres@vpWidthF = 0.8
cnres@vpHeightF = 0.8
cnres@cnFillOn = True
cnres@cnFillPalette = "BlueYellowRed"
cnres@mpOutlineOn = False ;-- don't use NCL's map outlines
cnres@mpMinLatF = minlat
cnres@mpMaxLatF = maxlat
cnres@mpMinLonF = minlon
cnres@mpMaxLonF = maxlon
cnres@lbBoxMinorExtentF = 0.1 ;-- decrease the labelbar box height
cnres@pmLabelBarOrthogonalPosF = -0.03 ;-- move the labelbar upward
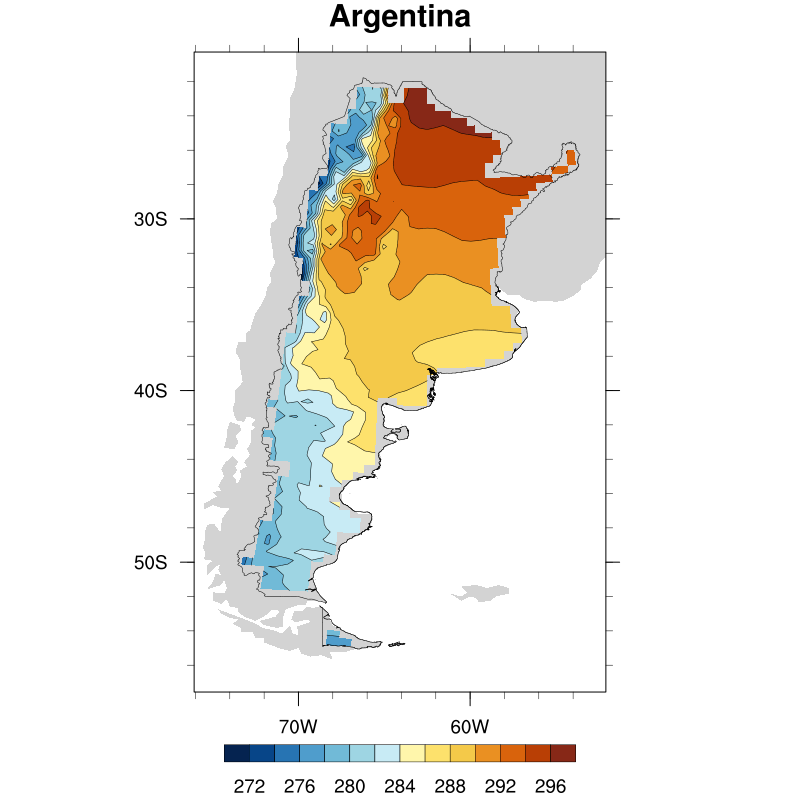
cnres@tiMainString = "Argentina"
plot = gsn_csm_contour_map(wks,mask_data,cnres) ;-- create contour plot
;-- add shapefile polyline content
plres = True
plres@gsLineColor = "black"
pid = gsn_add_shapefile_polylines(wks,plot,shpname,plres)
;-- draw the plot and advance the frame
draw(plot)
frame(wks)
Result: