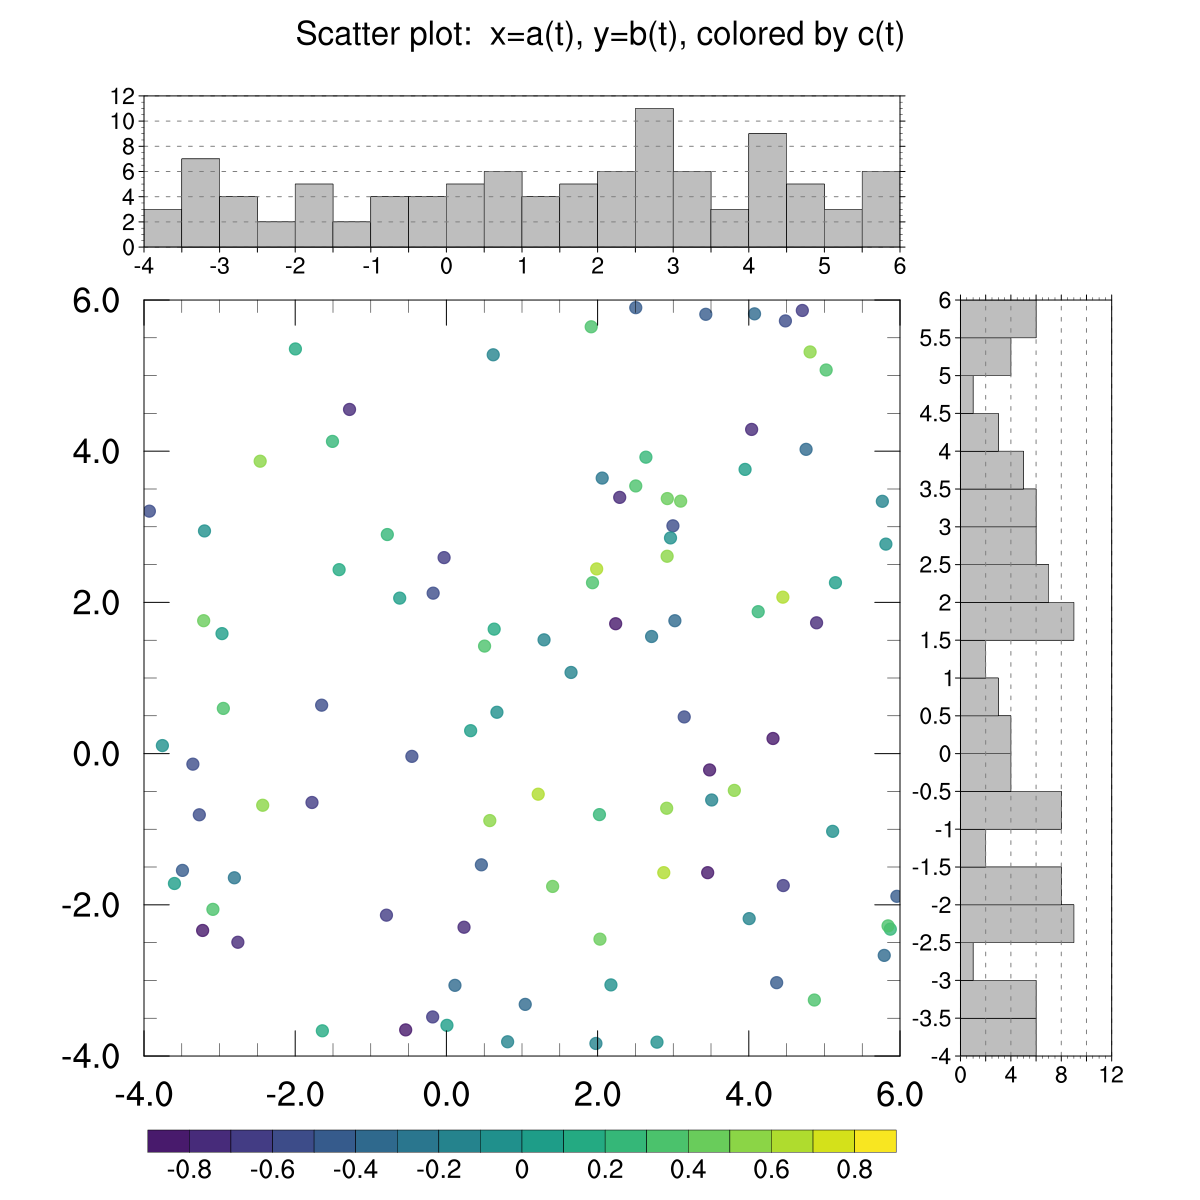
DKRZ NCL example scatter plot with two attached histograms#
Example script:
;----------------------------------------------------------------------
; Procedure add_labelbar: attach a vertical labelbar to the right
; side of the plot
;----------------------------------------------------------------------
undef("add_histogram")
function add_histogram(wks, plot, data, levels, orient)
local vph, vpw, w, h

begin
  print("----> add_histogramm - "+orient)

  getvalues plot ;-- retrieve viewport width and height
     "vpWidthF" : vpw
     "vpHeightF" : vph
  end getvalues

  if(orient .eq."horizontal") then
    w = vpw
    h = 0.2*vph
  else
    h = vpw
    w = 0.2*vph
  end if

  ;-- set resources
  hres = True
  hres@gsnDraw = False
  hres@gsnFrame = False

  hres@vpWidthF = w
  hres@vpHeightF = h

  if(orient .eq. "vertical") then
    hres@gsnHistogramHorizontal = True ;-- draw horizontal histogram
    hres@tmXMajorGrid = True
    hres@tmXMajorGridLineColor = "gray50"
    hres@tmXMajorGridLineDashPattern = 2
    hres@trXMinF = 0.0
    hres@trXMaxF = 12.0
  else
    hres@tmYMajorGrid = True
    hres@tmYMajorGridLineColor = "gray50"
    hres@tmYMajorGridLineDashPattern = 2
    hres@trYMinF = 0.0
    hres@trYMaxF = 12.0
  end if

  hres@gsnHistogramClassIntervals = levels
  hres@gsnHistogramBarColors = "gray"
  hres@gsnHistogramBarWidthPercent = 100.

  hres@tmXBLabelFontHeightF = 0.014
  hres@tmYLLabelFontHeightF = 0.014

  hres@tmXBLabelStride = 2
  hres@tmXBLabelDeltaF = -0.7
  hres@tmYLLabelDeltaF = -0.7

  hres@tiXAxisString = ""
  hres@tiYAxisString = ""

  ;-- create histogram
  hist = gsn_histogram(wks,data,hres)

  return(hist)

end

;----------------------------------------------------------------------
; Procedure add_labelbar: attach a vertical labelbar to the right
; side of the plot
;----------------------------------------------------------------------
undef("add_labelbar")
procedure add_labelbar(wks,plot,colors,levels, orient)
local vph, vpw, nboxes, lbres, lbid, amres, annoid, labels

begin
  print("----> add_labelbar")

  ;-- retrieve viewport width and height
  getvalues plot ;-- get plot size for use in
     "vpHeightF" : vph ;-- creating labelbar
     "vpWidthF" : vpw
  end getvalues

  if(orient .eq. "horizontal") then
    vw = vpw
    vh = 0.1*vph
    ampa = -0.5
    amor = 0.63
  else if(orient .eq. "vertical") then
    vw = 0.15*vpw
    vh = 0.99*vph
    ampa = 0.55
    amor = 0.0
  end if
  end if

  ;-- define labels and retrieve the number of color boxes
  labels = levels+"" ;-- convert to type string
  nboxes = dimsizes(colors(:,0)) ;-- number of color boxes (nlevels+1)

  ;-- create labelbar
  lbres = True ;-- labelbar only resources
  lbres@vpWidthF = vw ;-- labelbar width
  lbres@vpHeightF = vh ;-- labelbar height

  lbres@lbAutoManage = False ;-- Necessary to control sizes
  lbres@lbFillColors = colors ;-- labelbar colors
  lbres@lbMonoFillPattern = True ;-- Solid fill pattern
  lbres@lbLabelFontHeightF = 0.016 ;-- font height. default is small
  lbres@lbLabelAlignment = "InteriorEdges" ;-- line of box
  lbres@lbOrientation = orient
  lbres@lbPerimOn = False

  lbid = gsn_create_labelbar(wks,nboxes,labels,lbres)

  ;-- attach labelbar to the plot
  amres = True
  amres@amJust = "CenterLeft"
  amres@amParallelPosF = ampa
  amres@amOrthogonalPosF = amor

  plot@annoid = gsn_add_annotation(plot,lbid,amres)
end

;----------------------------------------------------------------------
; Main code
;----------------------------------------------------------------------
begin
  ;-- set minimum, maximum and interval value to group the data to color
  ;-- and create the labelbar
  cmin = -0.8
  cmax = 0.8
  cint = 0.01
  nt = 100 ;-- number of data per array

  ;-- x-,y- data
  min1d = -4.0
  max1d = 6.0
  hist_levels = fspan(toint(min1d),toint(max1d),21)

  ;-- generate random data 100 points (e.g. time steps) data for x-axis
  random_setallseed(136484749,19494848)
  a = random_uniform(min1d,max1d,nt)
  ;-- data for y-axis
  random_setallseed(363738674, 918273645)
  b = random_uniform(min1d,max1d,nt)
  ;-- data for coloring
  c = random_uniform(cmin,cmax,nt)

  ;-- title string
  title = "Scatter plot: x=a(t), y=b(t), colored by c(t)"

  ;-- set colormap name
  colmap = "MPL_viridis" ;-- colormap blue-green,yellow

  ;-- define levels for labelbar and colors
  levels = ispan(toint(cmin*10),toint(cmax*10),1) / 10.0 ;-- define levels
  nlevels = dimsizes(levels) ;-- number of levels

  ;-- open workstation
  wks_type = "png"
  wks_type@wkWidth = 1200
  wks_type@wkHeight = 1200
  wks = gsn_open_wks(wks_type,"plot_scatter_attach_two_histograms")
  gsn_define_colormap(wks,colmap)

  ;-- retrieve the colors; don't use the first dark blues
  colors = gsn_retrieve_colormap(wks) ;-- retrieve color map
  colind = toint(fspan(20,255,nlevels+1)) ;-- don't use first 20 colors
  colors := colors(colind,:)
  ncolors = dimsizes(colors)

  ;-- resources
  res = True ;-- plot mods desired
  res@gsnDraw = False ;-- don't draw plot, yet
  res@gsnFrame = False ;-- don't advance frame, yet

  res@trYMinF = min1d ;-- y-axis minimum to have enough space for legend
  res@trYMaxF = max1d ;-- y-axis maximum
  res@trXMinF = min1d ;-- y-axis minimum to have enough space for legend
  res@trXMaxF = max1d ;-- y-axis maximum

  res@tmLabelAutoStride = True ;-- use nice tick mark labels

  res@vpWidthF = 0.63 ;-- viewport width
  res@vpHeightF = 0.63 ;-- viewport height
  res@vpXF = 0.12 ;-- viewport x-position
  res@vpYF = 0.75 ;-- viewport y-position

  ;-- create blank plot
  plot = gsn_blank_plot(wks, res)

  ;-- group data and add it as filled circle markers, slightly transparent
  mres = True
  mres@gsMarkerThicknessF = 2.5 ;-- marker thickness
  mres@gsMarkerOpacityF = 0.8 ;-- marker opacity

  do i=0,nlevels-2
     ii := ind(levels(i) .le. c .and. levels(i+1) .gt. c)
     mres@gsMarkerIndex = 16 ;-- filled circle marker
     mres@gsMarkerSizeF = 0.01 ;-- marker size
     mres@gsMarkerColor = colors(i,:) ;-- marker color
     str_marker = unique_string("marker") ;-- generate unique string
     plot@$str_marker$ = gsn_add_polymarker(wks,plot,a(ii),b(ii),mres) ;-- add marker
  end do

  ;-- attach the labelbar to the plot
  add_labelbar(wks,plot,colors,levels,"horizontal")

  ;-- attach histogram 1
  hist1 = add_histogram(wks, plot, a, hist_levels, "horizontal")

  ;-- attach histogram to the plot
  amres = True
  amres@amJust = "CenterLeft"
  amres@amParallelPosF = -0.5
  amres@amOrthogonalPosF = -0.67
  anhist = unique_string("hist")
  plot@$anhist$ = gsn_add_annotation(plot,hist1,amres)

  ;-- attach histogram 2
  hist2 = add_histogram(wks, plot, b, hist_levels, "vertical")

  ;-- attach labelbar to the plot
  amres@amParallelPosF = 0.58
  amres@amOrthogonalPosF = 0.0
  anhist = unique_string("hist")
  plot@$anhist$ = gsn_add_annotation(plot,hist2,amres)

  ;-- draw the title
  txres = True
  txres = True ;-- text resources title string
  txres@txFontHeightF = 0.020 ;-- text font size
  txres@txJust = "CenterCenter" ;-- text justification
  gsn_text_ndc(wks,title,0.5,0.97,txres)

  ;-- draw plot and advance the frame
  draw(plot)
  frame(wks)

end
Result: