DKRZ NCL example use markers to plot data on grid#
Example:
;-------------------------------------------------------------------------------------
; DKRZ NCL Example: quality_points_per_grid_cell.ncl
;
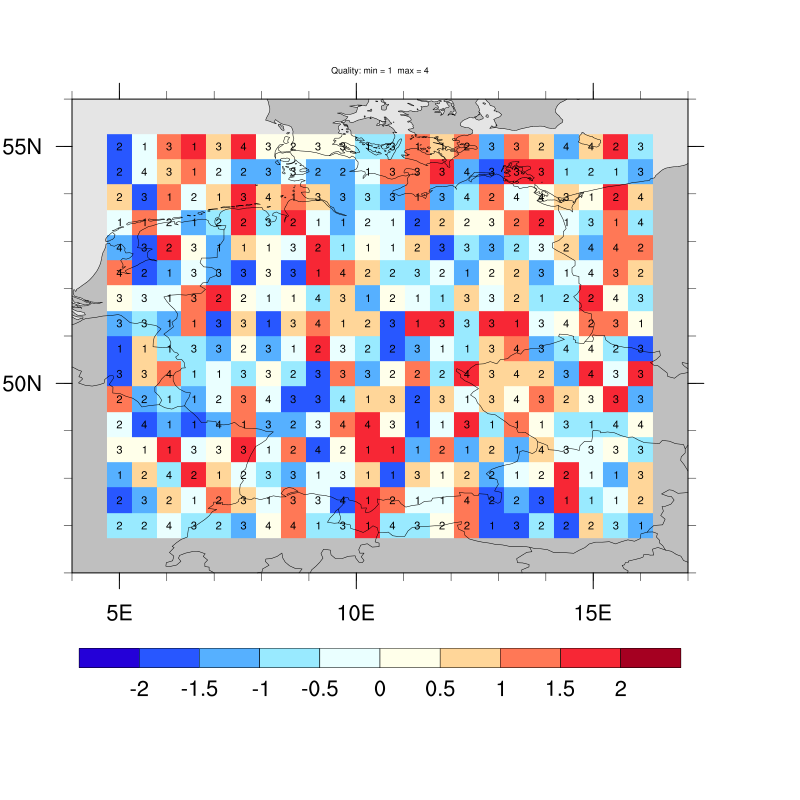
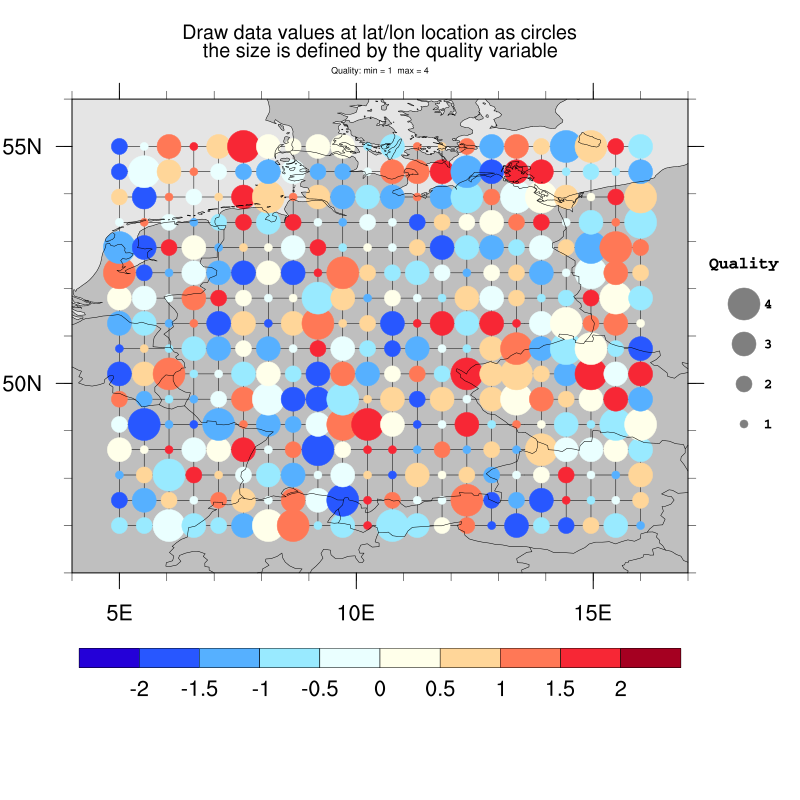
; Description: Draw two plots, first plot is a raster contour plot
; and the second shows the data using filled circles
; which are sized by a quality variable.
;
; First plot: - draw contour plot
;
; Second plot: - draw contour plot
; - clear the contour plot
; - determine marker colors
; - determine marker size (depending on quality variable)
; - draw markers (filled circles)
; - use dummy data
; 30.11.18 kmf
;-------------------------------------------------------------------------------------
begin
VALUES = True ;-- turn on/off value annotation of first plot
GRID = False ;-- turn on/off the data grid lines of second plot
;-----------------------------------------------------------------------------------
;-- which country to be shown
;-----------------------------------------------------------------------------------
mask_specs = (/"Germany"/)
minlat = 47.0 ;-- minimum latitude of map
maxlat = 55.0 ;-- maximum latitude of map
minlon = 5.0 ;-- minimum longitude of map
maxlon = 16.0 ;-- maximum longitude of map
;-----------------------------------------------------------------------------------
;-- generate dummy data and coordinates
;-- generate lat and lon arrays with named dimensions
;-----------------------------------------------------------------------------------
nlat = 16
nlon = 22
lat = fspan(minlat, maxlat,nlat)
lon = fspan(minlon, maxlon,nlon)
lat@units = "degrees_north"
lon@units = "degrees_east"
;-- generate dummy data with named dimensions
tempmin = -2.0
tempmax = 2.0
tempint = 0.5
temp = random_uniform(tempmin,tempmax,(/nlat,nlon/))
temp!0 = "lat"
temp!1 = "lon"
temp&lat = lat
temp&lon = lon
temp1d = ndtooned(temp)
ncells = dimsizes(temp1d)
;-- generate random dummy quality data
minqual = 1
maxqual = 4
quality = floor(random_uniform(minqual,maxqual+0.5,(/nlat,nlon/)))
quality!0 = "lat"
quality!1 = "lon"
quality&lat = lat
quality&lon = lon
quality1d = ndtooned(quality)
;-----------------------------------------------------------------------------------
;-- graphics
;-----------------------------------------------------------------------------------
;-- choose color map
cmap = "BlueDarkRed18"
;-- open workstation
wks = gsn_open_wks("png","plot_quality_per_cell")
;-----------------------------------------------------------------------------------
;-- contour plot resources
;-----------------------------------------------------------------------------------
res = True
res@gsnDraw = False
res@gsnFrame = False
res@gsnAddCyclic = False
res@gsnCenterString = "Quality: min = "+min(quality)+" max = "+max(quality)
res@gsnCenterStringFontHeightF = 0.008
res@vpXF = 0.09 ;-- viewport x-position
res@vpYF = 0.98 ;-- viewport y-position
res@vpWidthF = 0.77 ;-- viewport width
res@vpHeightF = 0.8 ;-- viewport height
res@cnFillMode = "RasterFill" ;-- use raster fill for contours
res@cnFillOn = True ;-- filled contour areas
res@cnLinesOn = False
res@cnInfoLabelOn = False
res@cnFillPalette = cmap ;-- set color map
res@cnLevelSelectionMode = "ManualLevels" ;-- set manual data levels
res@cnMinLevelValF = tempmin
res@cnMaxLevelValF = tempmax
res@cnLevelSpacingF = tempint
res@lbBoxMinorExtentF = 0.15 ;-- decrease height of labelbar
res@mpOutlineBoundarySets = "National" ;-- draw national map outlines
res@mpOceanFillColor = "gray90"
res@mpLandFillColor = "gray75"
res@mpInlandWaterFillColor = "gray75"
res@mpDataBaseVersion = "MediumRes" ;-- alias to Ncarg4_1
res@mpDataSetName = "Earth..4" ;-- higher map resolution
res@mpMinLatF = minlat-1.0
res@mpMaxLatF = maxlat+1.0
res@mpMinLonF = minlon-1.0
res@mpMaxLonF = maxlon+1.0
;-----------------------------------------------------------------------------------
;-- first, we have to draw a contour map in memory to get the level and color values
;-----------------------------------------------------------------------------------
contour = gsn_csm_contour_map(wks,temp,res)
;-- for checking purposes: draw text and markers at data locations !! this takes long !!
if(VALUES) then
txres = True
txres@gsFontColor = "black"
txres@txFontHeightF = 0.01
do j=0,nlat-1
do i=0,nlon-1
txid = unique_string("txid")
contour@$txid$ = gsn_add_text(wks, contour,""+quality(j,i),lon(i),lat(j),txres)
end do
end do
end if
;-- draw the first plot
draw(contour)
frame(wks)
;-----------------------------------------------------------------------------------
;-- create second plot
;-----------------------------------------------------------------------------------
plot = gsn_csm_contour_map(wks,temp,res)
;-- retrieve used levels and colors
getvalues plot@contour
"cnFillColors" : colors ;-- get the colors used
"cnLevels" : levels ;-- retrieve levels
end getvalues
ncolors = dimsizes(colors) ;-- number of used colors
nlevels = dimsizes(levels) ;-- number of used levels
print("ncells: "+ncells)
print("ncolors: "+ncolors)
print("nlevels: "+nlevels)
;-- clean the plot that we can see the markers instead of filled cells
plot = setColorContourClear(plot,min(temp)-1.,max(temp)+1.) ;-- clear plot, but keep all the information
;-- draw data coordinate grid lines just to see the lon/lat lines at cell center
if(GRID) then
pres = True
pres@gsnDraw = False
pres@gsnFrame = False
pres@gsnCoordsAsLines = True ;-- default: points
pres@gsnCoordsAttach = True ;-- attach the coordinate grid lines
gsn_coordinates(wks,plot,temp,pres) ;-- draw grid lines
end if
;-- now, create the marker size for each cell; marker sizes for quality 1-4
marker_sizes = fspan(0.01,0.04,4)
ms_array = new(ncells,float) ;-- create array for marker sizes depending
;-- on quality1d
do ll=minqual,maxqual
indsize := ind(quality1d .eq. ll)
if(any(.not. ismissing(indsize))) then
ms_array(indsize) = marker_sizes(ll-1)
end if
end do
;-- marker resources
plmres = True
plmres@gsMarkerIndex = 16 ;-- filled circles
;-- now, create the color array for each cell from temp1d
gscolors = new(ncells,integer)
;-- set color for data less than given minimum value
vlow = ind(temp1d .lt. levels(0)) ;-- get the indices of values less levels(0)
if(any(.not. ismissing(vlow))) then
gscolors(vlow) = colors(0) ;-- choose color
end if
;-- set colors for all cells in between tempmin and tempmax
do i=1,nlevels-1
vind := ind(temp1d .ge. levels(i-1) .and. temp1d .lt. levels(i)) ;-- get the indices of 'middle' values
if(any(.not. ismissing(vind))) then
gscolors(vind) = colors(i) ;-- choose the colors
end if
end do
;-- set color for data greater than given maximum
vhgh := ind(temp1d .gt. levels(nlevels-1)) ;-- get indices of values greater levels(nl)
if(any(.not. ismissing(vhgh))) then
gscolors(vhgh) = colors(ncolors) ;-- choose color
end if
;-- add the marker to the plot
n=0
do ii=0,nlat-1
do jj=0,nlon-1
k = jj+ii
plmres@gsMarkerSizeF = ms_array(n) ;-- marker size
plmres@gsMarkerColor = gscolors(n) ;-- marker color
str = unique_string("plmark")
plot@$str$ = gsn_add_polymarker(wks,plot,lon(jj),lat(ii),plmres) ;-- add marker to plot
n = n + 1
end do
end do
;-----------------------------------------------------------------------------------
;-- add marker size legend
;-----------------------------------------------------------------------------------
legres = True ;-- legend resources
legres@gsMarkerIndex = 16 ;-- filled dots
legres@gsMarkerColor = "gray50" ;-- legend marker color
txres = True ;-- text resources
txres@gsFontColor = "black"
txres@txFontHeightF = 0.01
txres@txFont = 30
x = 0.93
y = 0.47
ik = 0
do il=minqual,maxqual
legres@gsMarkerSizeF = marker_sizes(ik)
gsn_polymarker_ndc(wks,x,y,legres)
gsn_text_ndc(wks,""+il,x+0.03,y,txres)
y = y + 0.05
ik = ik + 1
end do
txres@txFontHeightF = 0.012
gsn_text_ndc(wks,"Quality",x,y,txres) ;-- legend title
;-- add title string
getvalues plot
"vpWidthF" : vpw
"vpXF" : vpx
end getvalues
xpos = vpw/2 + vpx
title1 = "Draw data values at lat/lon location as circles"
title2 = "the size is defined by the quality variable"
txres@txFont = 21
txres@txFontHeightF = 0.018
gsn_text_ndc(wks,title1,xpos,0.96,txres)
gsn_text_ndc(wks,title2,xpos,0.935,txres)
;-----------------------------------------------------------------------------------
;-- draw the second plot and advance the frame
;-----------------------------------------------------------------------------------
draw(plot)
frame(wks)
end
Result: