DKRZ NCL FESOM data example#
Example script:
;---------------------------------------------------------------
;-- DKRZ NCL example: FESOM_topography_CylindricalEquidistant.ncl
;--
;-- Data: FESOM model
;--
;-- Grid type: unstructured grid
;--
;-- Variable: topo (topography) in meter
;--
;-- Settings: CellFill, CylindricalEquidistant
;--
;-- NCL version: requires 6.2.x for faster polygon drawing
;-- uses resource gsSegments
;--
;-- 10.03.16 meier-fleischer(at)dkrz.de
;---------------------------------------------------------------
begin
start_time = get_cpu_time()
diri = "$HOME/data/FESOM/" ;-- data directory
fili = "fesom_topo_exact.nc" ;-- file name
f = addfile(diri + fili, "r" ) ;-- add grid file (not contained in data file!!!)
var = f->topo ;-- topo(ncells)
;-- retrieve sfXArray/sfYArray data
x = f->lon ;-- cell center, lon
y = f->lat ;-- cell center, lat
x!0 = "lon" ;-- set named dimension lon
y!0 = "lat" ;-- set named dimension lat
x@units = "degrees_east" ;-- set lon units
y@units = "degrees_north" ;-- set lat units
;-- define the cell polygon points
vlon = f->lon_vertices ;-- cell longitude vertices
vlon = where(vlon.lt.0, vlon + 360, vlon) ;-- longitude: 0-360
vlat = f->lat_vertices ;-- cell latitude vertices
nv = dimsizes(vlon(0,:)) ;-- number of points in polygon
;-- print some information to stdout
print("")
print("Data variable Min: " + min(var) + " Max: " + max(var))
print("Data longitude Min: " + min(vlon) + " Max: " + max(vlon))
print(" Polygon points: " + nv)
print("")
;-- open workstation
wks_type = "png"
wks_type@wkWidth = 1024
wks_type@wkHeight = 1024
wks = gsn_open_wks(wks_type,"plot_FESOM_topography_CylEqui")
;-- set resources
res = True
res@vpWidthF = 0.9 ;-- viewport width
res@vpHeightF = 0.7 ;-- viewport height
res@vpXF = 0.05 ;-- viewport start position
res@vpYF = 0.85 ;-- viewport start position
res@cnFillOn = True ;-- turn on contour fill
res@cnFillMode = "CellFill" ;-- use CellFill mode
res@cnFillPalette = "GMT_relief" ;-- choose color map
res@cnSpanFillPalette = True ;-- span color map
res@cnFillColors = ispan(2,122,1) ;-- use color indices
res@cnLevelSelectionMode = "ManualLevels" ;-- use manual contour line levels
res@cnMinLevelValF = -10000 ;-- contour min. value
res@cnMaxLevelValF = 0 ;-- contour max. value
res@cnLevelSpacingF = 100 ;-- contour interval
res@cnLinesOn = False ;-- turn lines off
res@cnLineLabelsOn = False ;-- turn labels off
res@sfXArray = x ;-- transform x to mesh scalar field
res@sfYArray = y ;-- transform y to mesh scalar field
res@sfXCellBounds = vlon ;-- needed if set cnFillMode = "CellFill"
res@sfYCellBounds = vlat ;-- needed if set cnFillMode = "CellFill"
res@mpMinLatF = -45 ;-- minimum latitude
res@mpMaxLatF = 60 ;-- maximum latitude
res@mpMinLonF = 95 ;-- minimum longitude
res@mpMaxLonF = 200 ;-- maximum longitude
res@mpCenterLonF = 150 ;-- center longitude
res@mpPerimOn = False ;-- don't draw the box around the plot
res@tmYLLabelFontHeightF = 0.014 ;-- increase y-axis label font
res@lbBoxMinorExtentF = 0.10 ;-- decrease height of labelbar boxes
res@pmLabelBarOrthogonalPosF = -0.016 ;-- move labelbar upward
res@lbLabelOffsetF = 0.05 ;-- move labelbar labels upward
res@lbLabelFontHeightF = 0.010 ;-- increase labelbar label font
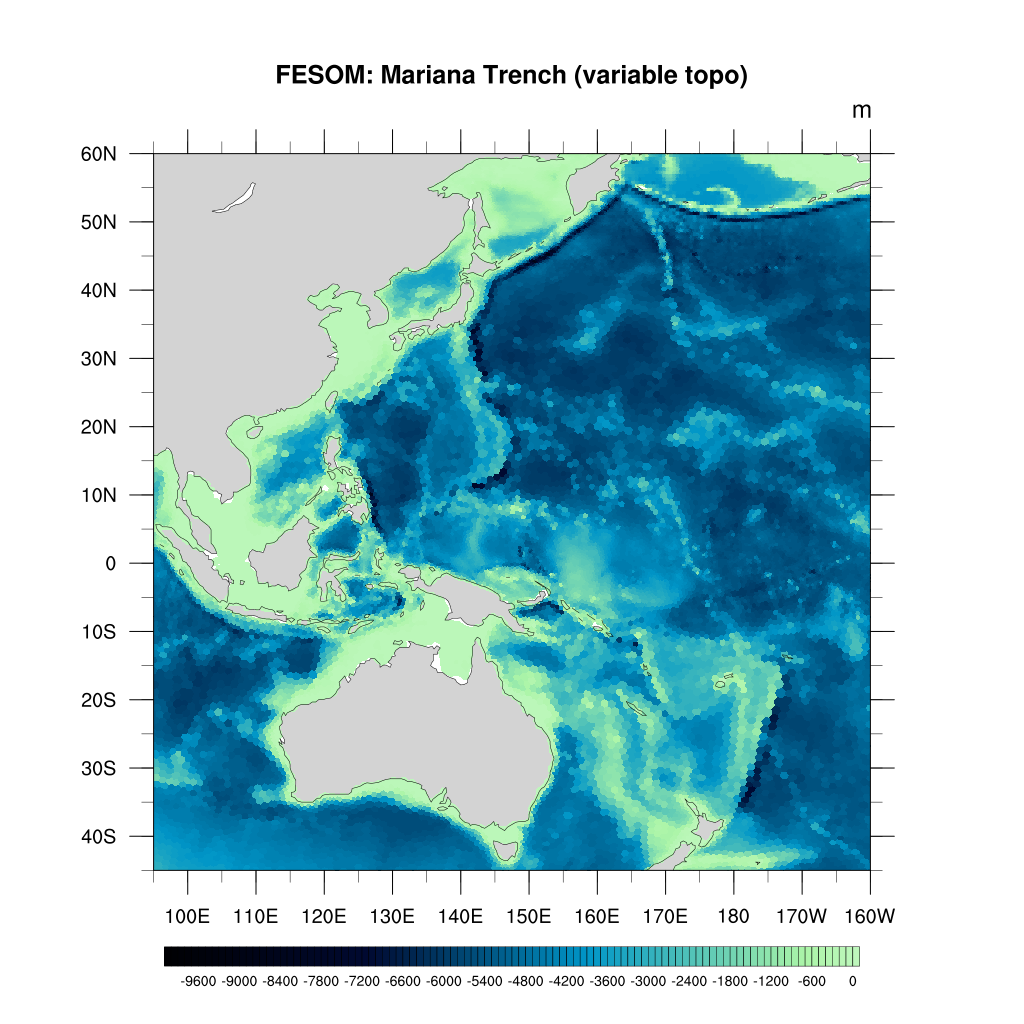
res@tiMainString = "FESOM: Mariana Trench (variable topo)"
res@tiMainFontHeightF = 0.018 ;-- increase title font
res@gsnMajorLatSpacing = 10 ;-- major grid lat spacing
res@gsnMinorLatSpacing = 5 ;-- minor grid lat spacing
res@gsnMajorLonSpacing = 10 ;-- major grid lon spacing
res@gsnMinorLonSpacing = 5 ;-- minor grid lon spacing
;-- create the plot
plot = gsn_csm_contour_map(wks,var,res)
print("--> FESOM Mariana Trench plot done...")
print("")
;-- calculate total elapsed time for this script
diff_time = get_cpu_time() - start_time
print("=====> CPU Elapsed Time ("+res@cnFillMode+"): "+diff_time+" seconds <=====")
end
Result: