DKRZ NCL FESOM grid example#
DKRZ NCL script:
;---------------------------------------------------------------
; DKRZ - NCL Example: NCL_FESOM_grid.ncl
;
; Grid type: unstructured grid
;
; Settings: polygons filled with color yellow
;
; Data files: FESOM_testmesh.convex.nc (nv=9)
; FESOM_testmesh.exact.nc (nv=18)
;
; NCL version: requires 6.2.x for faster polygon drawing
; uses resource gsSegments
;
; 2015-03-17 kmf
;---------------------------------------------------------------
begin
start_date = toint(systemfunc("date +%s")) ;-- computing start time
;-- define file name
diri = "$HOME/data/FESOM/" ;-- can't be provided - sorry!
;-- choose data file
fili = "FESOM_testmesh.convex.nc"
;-- open file
f = addfile(diri + fili, "r" )
;-- define the cell polygon points
vlon = f->lon_vertices ;-- cell longitude vertices
vlon = where(vlon.lt.0, vlon + 360, vlon) ;-- longitude: 0-360
vlat = f->lat_vertices ;-- cell latitude vertices
nv = dimsizes(vlon(0,:)) ;-- number of points in polygon
;-- print some information to stdout
print("")
print("Data longitude Min: " + min(vlon))
print(" Max: " + max(vlon))
print(" Polygon points: " + nv)
print("")
;-- open workstation
wks = gsn_open_wks("png","plot_FESOM_grid_convex") ;-- open a workstation
;-- set resources
mres = True
mres@gsnDraw = False
mres@gsnFrame = False
mres@gsnMaximize = True
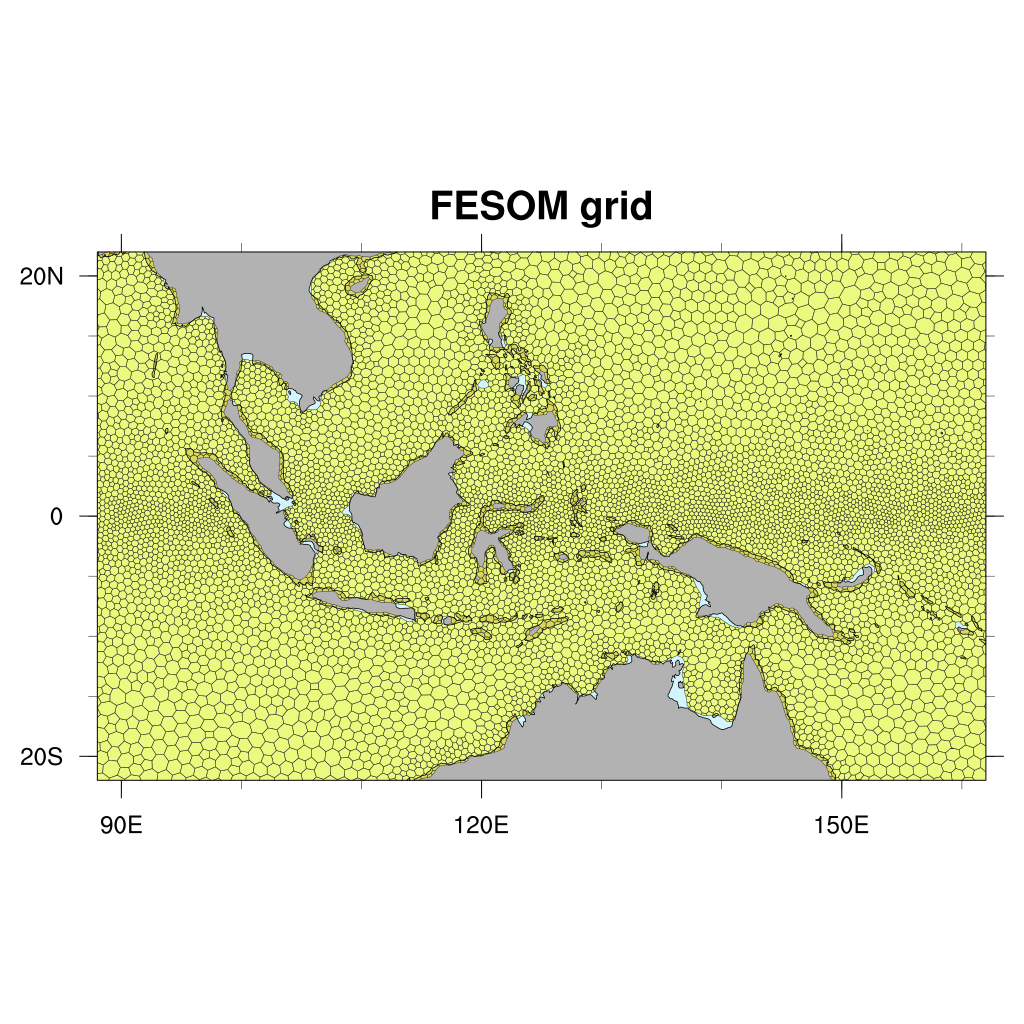
mres@tiMainString = "FESOM grid"
mres@mpFillOn = True ;-- fill map grey
mres@mpOutlineOn = True ;-- outline map
mres@mpGridLineColor = "grey60" ;-- grid line color
mres@mpGridAndLimbOn = False ;-- draw grid lines
mres@mpGeophysicalLineColor = "black" ;-- outline color
mres@mpGeophysicalLineThicknessF = 1.5 ;-- thickness of continental outlines
mres@mpPerimOn = False ;-- don't draw the box around the plot
mres@mpDataBaseVersion = "MediumRes" ;-- map resolution
mres@mpGreatCircleLinesOn = False ;-- important: v6.2.0 False !!
mres@mpOceanFillColor = (/ 0.824, 0.961, 1.0 /) ;-- light blue
mres@mpInlandWaterFillColor = (/ 0.824, 0.961, 1.0 /) ;-- light blue
mres@mpLandFillColor = (/ 0.7, 0.7, 0.7 /) ;-- beige
mres@mpPerimOn = False ;-- don't draw the box around the plot
mres@mpMinLonF = 88
mres@mpMaxLonF = 162
mres@mpMinLatF = -22
mres@mpMaxLatF = 22
;-- draw the map
map = gsn_csm_map(wks,mres) ;-- create the map
;-- set polygon resources
pres = True
pres@gsEdgesOn = True ;-- draw polygon edges
pres@gsEdgeColor = "grey20" ;-- polygon outline color
pres@gsFillColor = "yellow" ;-- polygon fill color
pres@gsFillOpacityF = 0.5 ;-- polygon opacity
pres@gsSegments = ispan(0,dimsizes(vlon(:,0))*nv, nv)
gsid = gsn_add_polygon(wks,map,ndtooned(vlon),ndtooned(vlat),pres)
draw(map)
frame(wks)
end_date = toint(systemfunc("date +%s")) ;-- computing time
print("--> Used CPU time: "+(end_date-start_date)+"s")
end
Result: