DKRZ NCL Germany sunshine duration colored by temperature#
Example script:
;---------------------------------------------------------------
; DKRZ NCL Example: sunshine_duration_colored_by_temperature.ncl
;
; Description: draw yearly sunshine duration hours and
; color it with temperature
;
; NCL version: requires version > 6.5.0 to use elseif
;
; 24.07.18 kmf
;---------------------------------------------------------------
; Procedure to attach a labelbar.
;---------------------------------------------------------------
undef("add_labelbar")
procedure add_labelbar(wks,plot,colors,labels,position)
local vph, vpw, vpx, vpy, nboxes, lbres, lbid, amres, annoid
begin
getvalues plot
"vpHeightF" : vph
"vpWidthF" : vpw
"vpXF" : vpx
"vpYF" : vpy
end getvalues
nboxes = dimsizes(colors)
lbres = True ;-- labelbar only resources
lbres@lbAutoManage = False ;-- necessary to control sizes
if(position .eq. "vertical") then
lbres@vpWidthF = 0.15 * vpw ;-- labelbar width
lbres@vpHeightF = 0.95 * vph ;-- labelbar height
lbres@lbOrientation = "Vertical"
elseif(position .eq. "horizontal") then
lbres@vpWidthF = vpw ;-- labelbar width
lbres@vpHeightF = 0.08 ;-- labelbar height
lbres@lbOrientation = "Horizontal"
end if
lbres@lbFillColors = colors ;-- labelbar colors
lbres@lbMonoFillPattern = True ;-- solid fill pattern
lbres@lbLabelFontHeightF = 0.016 ;-- label size
lbres@lbLabelAlignment = "InteriorEdges" ;-- center of box
lbres@lbPerimOn = False
lbid = gsn_create_labelbar(wks,nboxes,labels,lbres)
amres = True
amres@amJust = "CenterLeft"
if(position .eq. "horizontal") then
amres@amParallelPosF = -0.5
amres@amOrthogonalPosF = 0.78
elseif(position .eq. "vertical") then
amres@amParallelPosF = 0.52
amres@amOrthogonalPosF = 0.0
end if
plot@annoid = gsn_add_annotation(plot,lbid,amres)
end
;---------------------
; MAIN
;---------------------
begin
file1 = "$HOME/data/DWD/annual_sunshine_duration_regional_averages_sd_year.txt"
file2 = "$HOME/data/DWD/annual_air_temperature_mean_regional_averages_tm_year.txt"
delim = ";"
;-- read sunshine duration data
data1 = asciiread(file1,-1,"string")
year1 = toint(str_get_field(data1(2:),1,delim))
sdur = tofloat(str_get_field(data1(2:),19,delim))
sdur@units = "h"
nx = dimsizes(year1)
;-- read sunshine duration data
data2 = asciiread(file2,-1,"string")
year2 = toint(str_get_field(data2(2:),1,delim))
temp = tofloat(str_get_field(data2(2:),19,delim))
temp@units = "~S~o~N~C"
tempmin = min(temp)
tempmax = max(temp)
tempstep = fspan(tempmin,tempmax,21)
nt = dimsizes(tempstep)
labels = ""+sprintf("%.1f",tempstep)
print("-----------------------------------")
print("tempmin: "+tempmin)
print("tempmax: "+tempmax)
print("-----------------------------------")
start_year = year1(0)
y1ind = ind(year2 .eq. start_year)
print("Starting year: "+year2(y1ind))
;-- read color map and assign color index array
cmap = read_colormap_file("cmp_b2r")
cmap := cmap(20::2,:)
ncols = dimsizes(cmap(:,0))
colors = new(nx,integer)
;-- generate the color index for each bar
do i=0,nx-1
if(ismissing(temp(i))) then
colors(i) = -1
else
do j=0,dimsizes(tempstep)-1
if (temp(i) .lt. tempstep(0)) then
colors(i) = 0
elseif (temp(i) .ge. tempstep(dimsizes(tempstep)-1)) then
colors(i) = nx
elseif (temp(i) .ge. tempstep(j) .and. temp(i) .lt. tempstep(j+1)) then
colors(i) = j+1
end if
end do
end if
end do
;-- open workstation
wks = gsn_open_wks("png","plot_sunshine_duration")
;-- set resources
res = True
res@gsnDraw = False
res@gsnFrame = False
res@vpXF = 0.12
res@vpYF = 0.8
res@vpWidthF = 0.8
res@vpHeightF = 0.4
res@trXMinF = min(year1)-1 ;-- adds space on either end
res@trXMaxF = max(year1)+1 ;-- of the 1st and last bars
res@trYMinF = min(sdur)-10. ;-- adds space on either end
res@trYMaxF = max(sdur)+10. ;-- of the 1st and last bars
res@gsnXYBarChart = True ;-- turn on bar chart
res@gsnXYBarChartBarWidth = 0.75 ;-- change bar widths
res@gsnXYBarChartColors = cmap(colors,:)
res@tmXBLabelFontHeightF = 0.012
res@tmXBLabelFontHeightF = 0.012
res@tiXAxisString = "Years" ;-- x-axis title string
res@tiYAxisString = "Sunshine duration ["+sdur@units+"]" ;-- y-axis title string
res@tiXAxisFontHeightF = 0.014
res@tiYAxisFontHeightF = 0.014
;-- create the plot
plot = gsn_csm_xy(wks,year1,sdur,res)
;-- add labelbar
add_labelbar(wks,plot,cmap,labels,"horizontal")
;-- add title strings
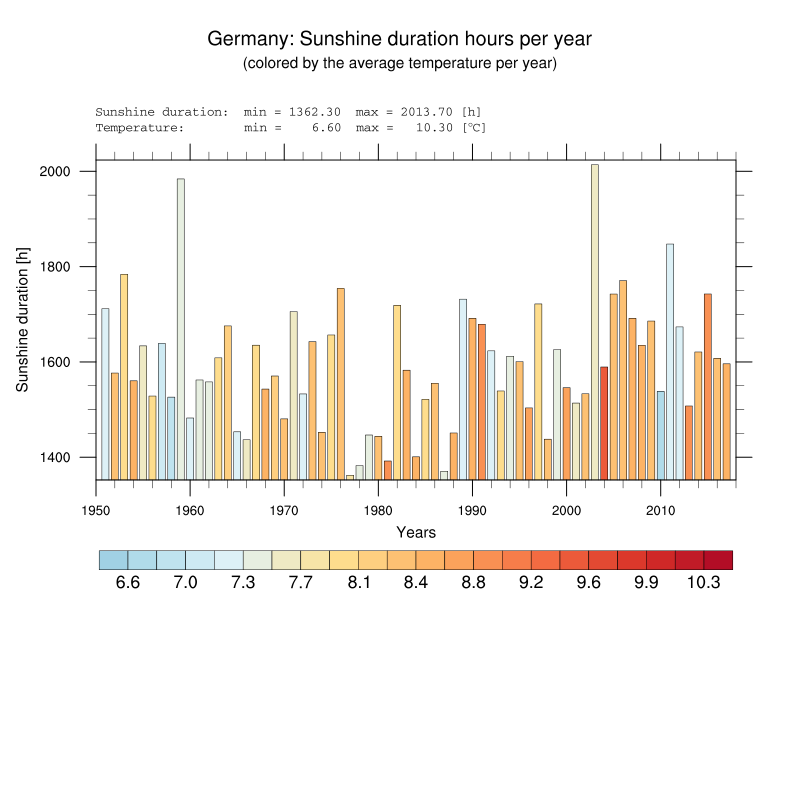
title1 = "Germany: Sunshine duration hours per year"
title2 = "(colored by the average temperature per year)"
title3 = "Sunshine duration: min ="+sprintf("%8.2f",min(sdur))+" max ="+sprintf("%8.2f",max(sdur))+" ["+sdur@units+"]"
title4 = "Temperature: min ="+sprintf("%8.2f",min(temp))+" max ="+sprintf("%8.2f",max(temp))+" ["+temp@units+"]"
txres = True
txres@txFontHeightF = 0.018
gsn_text_ndc(wks,title1,0.5,0.95,txres)
txres@txFontHeightF = 0.014
gsn_text_ndc(wks,title2,0.5,0.92,txres)
txres@txJust = "CenterLeft"
txres@txFont = 29
txres@txFontHeightF = 0.009
gsn_text_ndc(wks,title3,res@vpXF,0.86,txres)
txres@txFontHeightF = 0.009
gsn_text_ndc(wks,title4,res@vpXF,0.84,txres)
;-- draw the plot and advance the frame
draw(plot)
frame(wks)
end
Result: