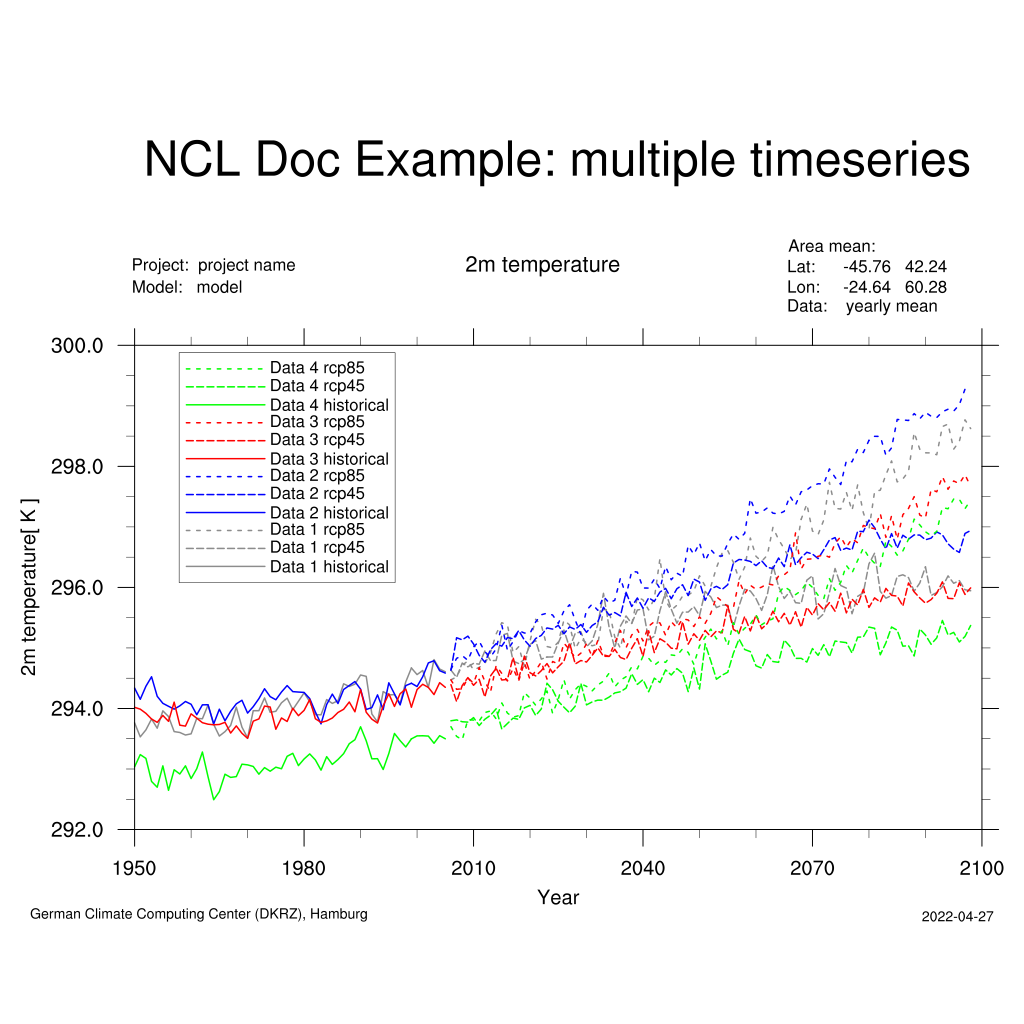
DKRZ NCL multiple time series example#
DKRZ NCL script:
;-----------------------------------------------------------------
;
;  DKRZ - NCL Example:   NCL_multiple_timeseries.ncl
;
;  30.10.14  kmf
;-----------------------------------------------------------------
load "$NCARG_ROOT/lib/ncarg/nclscripts/csm/shea_util.ncl"

begin
  diri  = "./"
  fil1  = "tas_mod1_hist_rectilin_grid_2D.nc"
  fil2  = "tas_mod1_rcp45_rectilin_grid_2D.nc"
  fil3  = "tas_mod1_rcp85_rectilin_grid_2D.nc"
  fil4  = "tas_mod2_hist_rectilin_grid_2D.nc"
  fil5  = "tas_mod2_rcp45_rectilin_grid_2D.nc"
  fil6  = "tas_mod2_rcp85_rectilin_grid_2D.nc"
  fil7  = "tas_mod3_hist_rectilin_grid_2D.nc"
  fil8  = "tas_mod3_rcp45_rectilin_grid_2D.nc"
  fil9  = "tas_mod3_rcp85_rectilin_grid_2D.nc"
  fil10 = "tas_mod4_hist_rectilin_grid_2D.nc"
  fil11 = "tas_mod4_rcp45_rectilin_grid_2D.nc"
  fil12 = "tas_mod4_rcp85_rectilin_grid_2D.nc"

  f1    = addfile(diri+fil1,  "r")
  f2    = addfile(diri+fil2,  "r")
  f3    = addfile(diri+fil3,  "r")
  f4    = addfile(diri+fil4,  "r")
  f5    = addfile(diri+fil5,  "r")
  f6    = addfile(diri+fil6,  "r")
  f7    = addfile(diri+fil7,  "r")
  f8    = addfile(diri+fil8,  "r")
  f9    = addfile(diri+fil9,  "r")
  f10   = addfile(diri+fil10, "r")
  f11   = addfile(diri+fil11, "r")
  f12   = addfile(diri+fil12, "r")
;---------------------------------------------------
  temp1           =  f1->tas(:,0,0,0)
  temp1@long_name = "2m temperature"
  temp2           =  f2->tas(:,0,0,0)
  temp2@long_name = "2m temperature"
  temp3           =  f3->tas(:,0,0,0)
  temp3@long_name = "2m temperature"
;---------------------------------------------------
  temp4           =  f4->tas(:,0,0,0)
  temp4@long_name = "2m temperature"
  temp5           =  f5->tas(:,0,0,0)
  temp5@long_name = "2m temperature"
  temp6           =  f6->tas(:,0,0,0)
  temp6@long_name = "2m temperature"
;---------------------------------------------------
  temp7           =  f7->tas(:,0,0,0)
  temp7@long_name = "2m temperature"
  temp8           =  f8->tas(:,0,0,0)
  temp8@long_name = "2m temperature"
  temp9           =  f9->tas(:,0,0,0)
  temp9@long_name = "2m temperature"
;---------------------------------------------------
  temp10           =  f10->tas(:,0,0,0)
  temp10@long_name = "2m temperature"
  temp11           =  f11->tas(:,0,0,0)
  temp11@long_name = "2m temperature"
  temp12           =  f12->tas(:,0,0,0)
  temp12@long_name = "2m temperature"
;---------------------------------------------------
  time = ispan(1950,2098,1)
  time@long_name = "Time"
;----------------------------------------------------
; to plot multiple lines, you must put them into a mulidimensional array
;----------------------------------------------------
  data            = new((/12,149/),float)
  data(0,0:55)    = temp1
  data(1,56:148)  = temp2
  data(2,56:148)  = temp3

  data(3,0:55)    = temp4
  data(4,56:148)  = temp5
  data(5,56:148)  = temp6

  data(6,0:55)    = temp7
  data(7,56:148)  = temp8
  data(8,56:148)  = temp9

  data(9,0:55)    = temp10
  data(10,56:148) = temp11
  data(11,56:148) = temp12

;-- open a workstation
  wks =  gsn_open_wks("png", "multi_timeseries")

;-- set resources
  res = True
  res@xyXStyle               = "Time"
  res@xyExplicitLegendLabels = (/ " Data 1 historical", " Data 1 rcp45", " Data 1 rcp85", \
                                  " Data 2 historical", " Data 2 rcp45", " Data 2 rcp85", \
                                  " Data 3 historical",   " Data 3 rcp45",   " Data 3 rcp85",\
                                  " Data 4 historical",   " Data 4 rcp45",   " Data 4 rcp85"/)
  res@xyLineColors           =  (/ "gray55", "gray55", "gray55", "blue", "blue", "blue", \
                                   "red", "red", "red", "green", "green", "green"/)
  res@xyDashPatterns         =  (/  0, 5, 2, 0, 5, 2, 0, 5, 2, 0, 5, 2/)
  res@xyLineThicknessF       =  3
  res@tiYAxisString          =  temp1@long_name+"[ K ]"
  res@tiYAxisFont            =  21
  res@tiYAxisFontAspectF     =  1.3
  res@tiYAxisFontHeightF     =  0.012
  res@tiXAxisString          = "Year"
  res@tiXAxisFont            =  21
  res@tiXAxisFontAspectF     =  1.3
  res@tiXAxisFontHeightF     =  0.012
  res@tiXAxisOffsetYF        =  0.0
  res@tiMainOffsetYF         =  0.11
  res@tiMainString           = "NCL Doc Example: multiple timeseries"
  res@tmXBLabelFontAspectF   =  1.3
  res@tmXBLabelFontHeightF   =  0.012
  res@trYMinF                =  292.0
  res@trYMaxF                =  300.0
  res@gsnMaximize            =  True
  res@gsnDraw                =  False
  res@gsnFrame               =  False
  res@vpXF                   =  0.25            ;-- set viewport resources
  res@vpYF                   =  0.6
  res@vpWidthF               =  0.7
  res@vpHeightF              =  0.4
  res@pmLegendDisplayMode    = "Always"
  res@lgLabelFontHeightF     =  0.01
  res@pmLegendWidthF         =  0.12            ;-- set legend width
  res@pmLegendHeightF        =  0.19            ;-- set legend height
  res@pmLegendOrthogonalPosF = -1.14            ;-- move legend up
  res@pmLegendParallelPosF   =  0.18            ;-- move legend right

;-- create plot
  plot = gsn_csm_xy(wks,time,data,res)

;-- set text resources
  txres               = True
  txres@txFontHeightF = 0.010

;-- text bottom
  TimeStamp           = systemfunc( "date +%F" )
  txres@txJust        = "BottomLeft"
  gsn_text_ndc(wks,"German Climate Computing Center (DKRZ), Hamburg",0.03,0.1, txres)
  txres@txJust        = "BottomRight"
  gsn_text_ndc(wks,TimeStamp,0.97, 0.1, txres)

;-- text top middle
  txres@txFontHeightF = 0.012
  txres@txJust        = "CenterCenter"
  gsn_text_ndc(wks,"~Z130~2m temperature~N~",  0.53, 0.74, txres)

;-- text top left side
  txres@txFontHeightF = 0.012
  txres@txJust        = "CenterLeft"
  gsn_text_ndc(wks,"Project:  project name",   0.13, 0.74, txres)
  gsn_text_ndc(wks,"Model:   model",          0.13, 0.72, txres)

;-- text top right side
  txres@txFontHeightF = 0.012
  txres@txJust        = "CenterLeft"
  gsn_text_ndc(wks,"Area mean:",               0.77, 0.76, txres)
  gsn_text_ndc(wks,"Lat:      -45.76   42.24", 0.77, 0.74, txres)
  gsn_text_ndc(wks,"Lon:     -24.64   60.28",  0.77, 0.72, txres)
  gsn_text_ndc(wks,"Data:    yearly mean",     0.77, 0.70, txres)

;-- draw the plot
  draw(plot)
  frame(wks)

end
Result:
