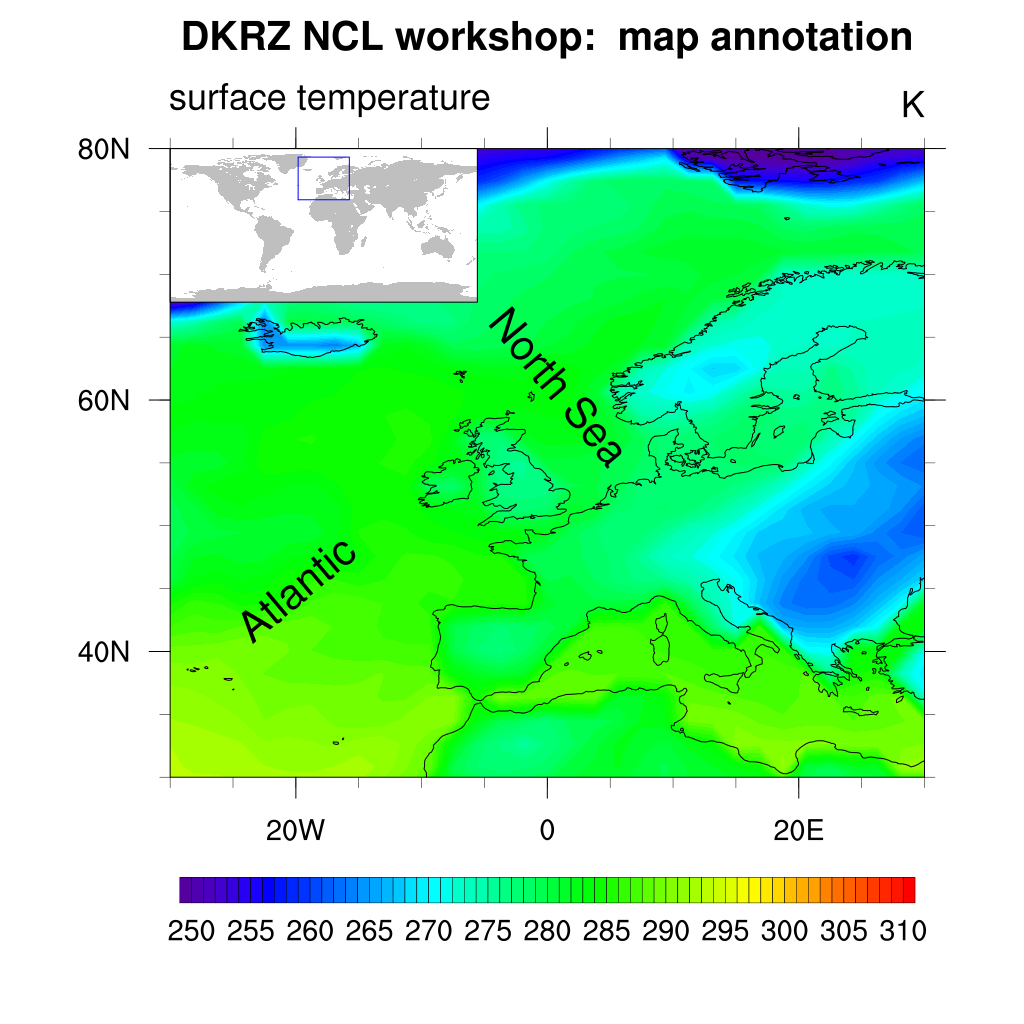
DKRZ NCL overlay small map on map plot example#
Example script:
;-----------------------------------------------------------------
;
;  DKRZ - NCL Example:   NCL_overlay_small_map_on_map_plot.ncl
;
;  04.03.16  kmf
;-----------------------------------------------------------------
begin
;-- read the data and define var
  f   =  addfile("$HOME/NCL/NCL_User_Guide/data/rectilinear_grid_2D.nc","r")
  var =  f->tsurf(0,:,:)

;-- define the workstation (plot type and name)
  wks_type = "png"
  wks_type@wkWidth  =  1024
  wks_type@wkHeight =  1024
  wks = gsn_open_wks(wks_type,"plot_small_map_section_on_map_plot_for_overview")

;-- set resources
  mres1                       =  True
  mres1@gsnDraw               =  False                  ;-- don't draw the plot yet
  mres1@gsnFrame              =  False                  ;-- don't advance the frame
  mres1@gsnMaximize           =  True                   ;-- maximize the plot output

  mres1@cnFillOn              =  True                   ;-- filled contours
  mres1@cnLinesOn             =  False                  ;-- don't draw contour lines
  mres1@cnFillPalette         = "rainbow"
  mres1@cnLevelSelectionMode  = "ManualLevels"          ;-- set contour levels manually
  mres1@cnMinLevelValF        =  250.                   ;-- minimum contour level
  mres1@cnMaxLevelValF        =  310.                   ;-- maximum contour level
  mres1@cnLevelSpacingF       =  1                      ;-- contour level spacing

  mres1@mpDataBaseVersion     = "MediumRes"             ;-- set map data base
  mres1@mpOutlineOn           =  True                   ;-- turn map outline on
  mres1@mpGeophysicalLineThicknessF = 2                 ;-- increase coastline thickness
  mres1@mpMinLonF             = -30.                    ;-- min lon
  mres1@mpMaxLonF             =  30.                    ;-- max lon
  mres1@mpMinLatF             =  30.                    ;-- min lat
  mres1@mpMaxLatF             =  80.                    ;-- max lat

  mres1@lbBoxMinorExtentF     =  0.15                   ;-- decrease height of labelbar

  mres1@tiMainString          = "DKRZ NCL workshop:  map annotation"   ;-- title string
  mres1@tiMainFontHeightF     =  0.02                   ;-- main title font size

;-- draw the main map
  map1 = gsn_csm_contour_map(wks, var, mres1)

;-- set resources for the smaller world map
  mres2                       =  True
  mres2@gsnDraw               =  False                  ;-- don't draw the plot yet
  mres2@gsnFrame              =  False                  ;-- don't advance the frame
  mres2@gsnLeftString         =  ""                     ;-- don't draw left string
  mres2@gsnRightString        =  ""                     ;-- don't draw right string

  mres2@vpWidthF              =  0.3                    ;-- set viewport width
  mres2@vpHeightF             =  0.3                    ;-- set viewport height

  mres2@mpLandFillColor       = "Gray75"                ;-- land fill color
  mres2@mpOceanFillColor      = "White"                 ;-- ocean fill color
  mres2@mpInlandWaterFillColor = "White"                ;-- inland water color

  mres2@tmXBOn                =  False                  ;-- turn off tickmarks at bottom
  mres2@tmXTOn                =  False                  ;-- turn off tickmarks at top
  mres2@tmYLOn                =  False                  ;-- turn off tickmarks at left side
  mres2@tmYROn                =  False                  ;-- turn off tickmarks at right side

;-- draw the smaller world map
  map2 = gsn_csm_map(wks, mres2)

;-- set polyline resources
  pres                      =  True
  pres@gsLineThicknessF     =  2.0                      ;-- polyline thickness
  pres@gsLineColor          = "blue"                    ;-- polyline color

;-- attach polyline to map2
  pbox = gsn_add_polyline(wks, map2, (/-30,30,30,-30,-30/), (/30,30,80,80,30/), pres)

;-- set annotation resources
  amres                     =  True
  amres@amJust              = "TopLeft"                ;-- labelbar justification
  amres@amParallelPosF      = -0.5                     ;-- move labelbar to the right of plot
  amres@amOrthogonalPosF    = -0.5                     ;-- move labelbar to the top of plot

;-- atach the labelbar to the plot
  annoid = gsn_add_annotation(map1,map2,amres)

;-- set text resources
  txres1                     =  True
  txres1@txFontHeightF       =  0.03
  txres1@txAngleF            =  40.                     ;-- rotate text string 40 degrees

;-- attach text to map1
  text1 = gsn_add_text(wks,map1,"Atlantic",-20,45,txres1)

;-- set text resources
  txres2                     =  True
  txres2@txFontHeightF       =  0.03
  txres2@txAngleF            =  -50.                     ;-- rotate text string 40 degrees

;-- attach text to map1
  text2 = gsn_add_text(wks,map1,"North Sea",1.0,61,txres2)

;-- draw the plot and advance the frame
  draw(map1)
  frame(wks)

end
Result: