DKRZ NCL plot a sub-region of curvilinear data example#
Example script:
;----------------------------------------------------
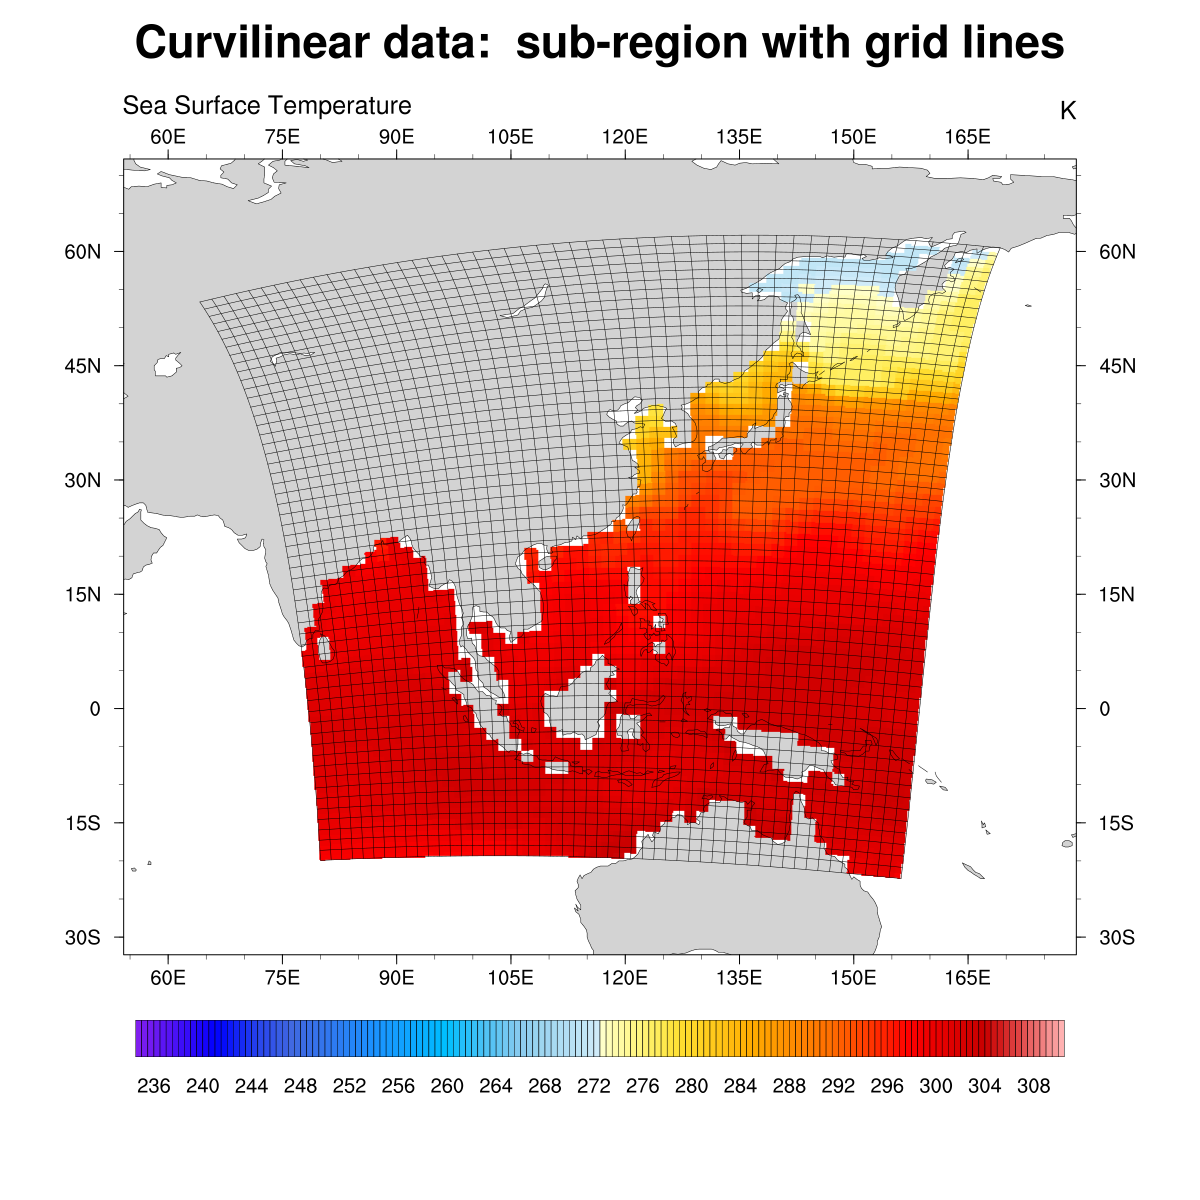
; DKRZ NCL example: subregion_of_curvilinear_data_plot_with_gridlines.ncl
;
; Description: - select a sub-region of the curvilinear data
; - attach gridlines of the subsetted data
;
; 01.04.16 meier-fleischer(at)dkrz.de
;----------------------------------------------------
begin
f = addfile("$HOME/NCL/NCL_User_Guide/data/tos_ocean_bipolar_grid.nc","r")
var = f->tos(0,:,:)
lon2d = f->lon
lat2d = f->lat
lon2d = where(lon2d .le. 180., lon2d, lon2d-360.)
;-- select lat/lon region
lons = (/ 80., 170./)
lats = (/-20., 60./)
;-- you cannot use "{" and "}" for coordinate subscripting, because
;-- lat2d and lon2d are not 1D coordinate arrays
ij = getind_latlon2d(lat2d, lon2d, lats, lons) ;-- retrieve indices of sub-region
ilat1 = ij(0,0) ;-- indices min lat
ilat2 = ij(1,0) ;-- indices max lat
ilon1 = ij(0,1) ;-- indices min lon
ilon2 = ij(1,1) ;-- indices max lon
var_sub = var(ilat1:ilat2,ilon1:ilon2) ;-- var data of sub-region
lat2d_sub = lat2d(ilat1:ilat2,ilon1:ilon2) ;-- lats of sub-region
lon2d_sub = lon2d(ilat1:ilat2,ilon1:ilon2) ;-- lons of sub-region
;-- open workstation
wks_type = "png"
wks_type@wkWidth = 1200
wks_type@wkHeight = 1200
wks = gsn_open_wks(wks_type,"plot_cclm_curvelinear_map_test")
;-- set resources
res = True
res@gsnDraw = False ;-- don't draw plot yet
res@gsnFrame = False ;-- don't advance frame
res@gsnMaximize = True ;-- maximize plot output
res@gsnAddCyclic = False ;-- don't add cyclic points
res@gsnLeftStringFontHeightF = 0.010 ;-- decrease left string font size
res@gsnRightStringFontHeightF = 0.010 ;-- decrease right string font size
;-- contour settings
res@cnFillMode = "RasterFill"
res@cnFillOn = True ;-- set contour fill
res@cnLinesOn = False ;-- don't draw contour lines
res@cnLevelSelectionMode = "ManualLevels" ;-- set manual contour levels
res@cnMinLevelValF = 235.0 ;-- min contour level
res@cnMaxLevelValF = 310.0 ;-- max contour level
res@cnLevelSpacingF = 0.5 ;-- contour level interval
;-- labelbar settings
res@lbBoxMinorExtentF = 0.17 ;-- decrease height of labelbar boxes
res@pmLabelBarOrthogonalPosF = -0.022 ;-- move labelbar upward
;-- use sub-region grid
res@sfYArray = lat2d_sub ;-- set y array to be used
res@sfXArray = lon2d_sub ;-- set x array to be used
;-- axis lat/lon settings
res@gsnMajorLatSpacing = 15 ;-- change maj lat tm spacing
res@gsnMajorLonSpacing = 15 ;-- change maj lon tm spacing
res@gsnMinorLatSpacing = 5 ;-- change maj lat tm spacing
res@gsnMinorLonSpacing = 5 ;-- change maj lon tm spacing
;-- y-axis
res@tmYRLabelsOn = True ;-- draw right side labels of map
res@tmYLLabelFontHeightF = 0.008 ;-- left side label font size
res@tmYLMajorLengthF = 0.005 ;-- left side major tickmarks length
res@tmYLMinorLengthF = 0.0025 ;-- left side minor tickmarks length
res@tmYRLabelFontHeightF = 0.008 ;-- right side label font size
res@tmYRMajorLengthF = 0.005 ;-- right side major tickmarks length
res@tmYRMinorLengthF = 0.0025 ;-- right side major tickmarks length
;-- x-axis
res@tmXTLabelsOn = True
res@tmXBLabelFontHeightF = 0.008 ;-- x bottom label font size
res@tmXBMajorLengthF = 0.005 ;-- x bottom major tickmarks length
res@tmXBMinorLengthF = 0.0025 ;-- x bottom major tickmarks length
res@tmXBLabelDeltaF = -0.6 ;-- increase distance between x-axis and labels
res@tmXTLabelFontHeightF = 0.008 ;-- x top label font size
res@tmXTMajorLengthF = 0.005 ;-- x top major tickmarks length
res@tmXTMinorLengthF = 0.0025 ;-- x top major tickmarks length
res@tmXBLabelDeltaF = -0.6 ;-- increase distance between x-axis and labels
;-- map settings
res@mpMinLatF = min(lat2d_sub)-10 ;-- map min lat
res@mpMaxLatF = max(lat2d_sub)+10 ;-- map max lat
res@mpMinLonF = min(lon2d_sub)-10 ;-- map min lon
res@mpMaxLonF = max(lon2d_sub)+10 ;-- map max lon
res@mpCenterLonF = (res@mpMinLonF+res@mpMaxLonF)/2. ;-- map center lon
;-- title string settings
res@tiMainString = "Curvilinear data: sub-region with grid lines"
res@tiMainFontHeightF = 0.018
;-- create the plot
plot = gsn_csm_contour_map(wks, var_sub, res)
;-- attach lat/lon grid lines of subsetted data
gsres = True
gsres@gsnCoordsLat = lat2d_sub ;-- use coordinate latitudes
gsres@gsnCoordsLon = lon2d_sub ;-- use coordinate longitudes
gsres@gsnCoordsAsLines = True ;-- draw grid as lines
gsres@gsnCoordsAttach = True ;-- attach it to plot
gsn_coordinates(wks,plot,var_sub,gsres) ;-- draw the grid lines of the data
;-- draw the plot and advance the frame
draw(plot)
frame(wks)
end
Result: