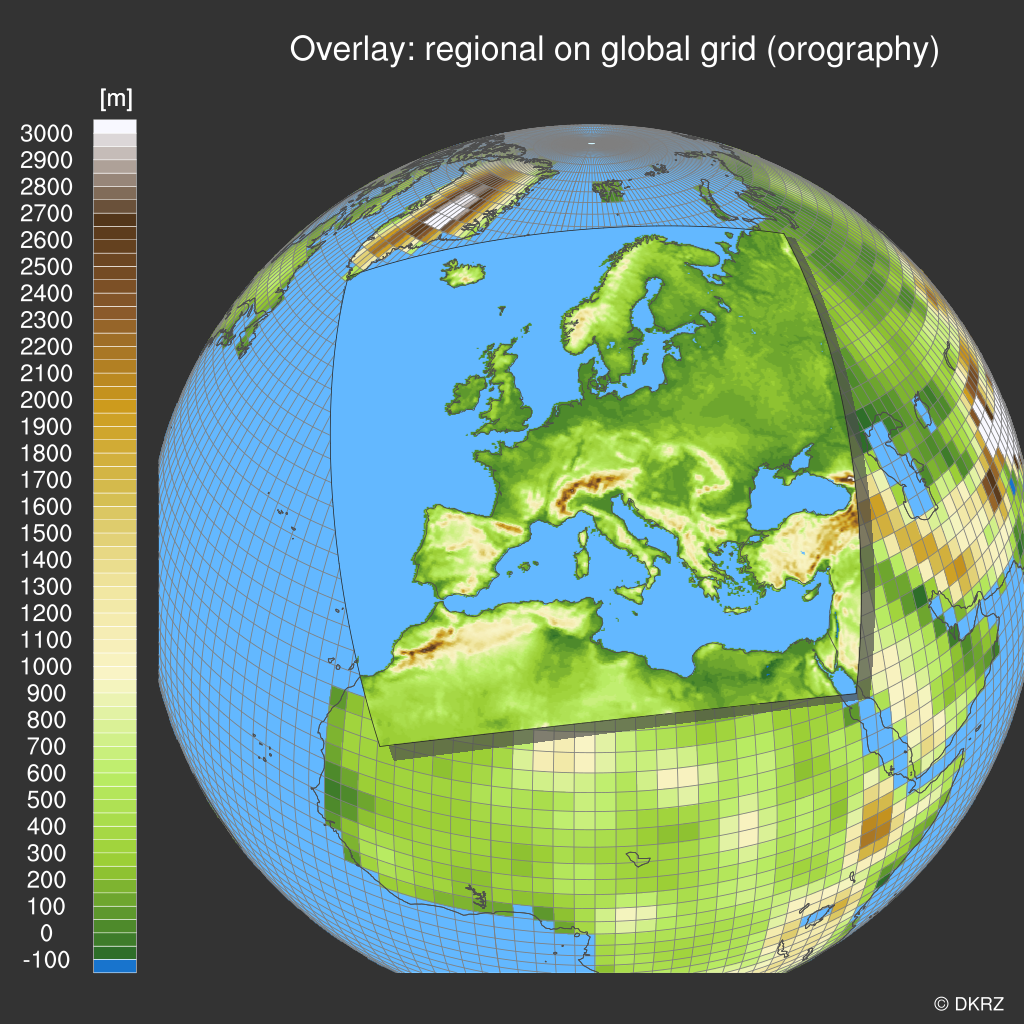
DKRZ NCL regional map overlayed on global map Satellite projection example#
Example script:
;-----------------------------------------------------------
; DKRZ NCL example: attach_map_to_map.ncl
;
; Description: Plot a regional map with 0.11 degrees
;              resolution on a global map with 1.875s
;              degree resolution
;
;     - Satellite projection
;     - define user procedure to draw grid lines from data grid
;       on global map
;     - turn off grid lines on regional map
;     - geophysical map outlines on both maps
;     - common color map
;     - common labelbar
;     - draw a shadow of the regional plot
;     - use gsn_text_ndc to draw title and copyright info strings
;
; 29.04.16 meier-fleischer(at)dkrz.de
;-----------------------------------------------------------

;-----------------------------------------------------------
;-- Procedure: draw_data_grid_lines
;--
;--    draw grid lines of origin latitudes and
;-- longitudes
;-----------------------------------------------------------
undef("draw_data_grid_lines")
procedure draw_data_grid_lines(wks,map,var)
local lats, lons, numlon, numlat, lon_step, lat_step, ilat, ilon, x, y

begin
 BOXES = 1   ;-- 0: lat/lon grid lines in cell center
 ;-- 1: lat/lon grid lines around cells (=boxes)
 lats = var&lat
 lons = var&lon
 lat_step = lats(1) - lats(0)
 lon_step = lons(1) - lons(0)
 numlat = dimsizes(lats)
 numlon = dimsizes(lons)

 lonadd = new(numlon+1,typeof(lons))   ;-- max. longitude less 360. so we have to add it
 lonadd(0:numlon-1) = lons
 lonadd(numlon) = lons(numlon-1)+lon_step

;-- grid line resources
 gres = True
 gres@gsLineColor = "grey50"   ;-- grid line color
 gres@gsLineThicknessF = 1.7   ;-- grid line thickness

;-- assign x and x arrays for the grid lines
 x = new(numlon+1,typeof(lons))
 y = new(numlon+1,typeof(lats))

;-- draw cell centers
 if(BOXES .eq. 0) then
    dx = 0.   ;-- cell center
    dy = 0.   ;-- cell center
 else
    dx = lon_step/2.   ;-- boxes
    dy = lat_step/2.   ;-- boxes
 end if

;-- draw horizontal lines
 x = lonadd + dx
 do ilat = 0,numlat-1
    y = lats(ilat) + dy
    str = unique_string("gridline") ;-- create a unique name
    map@$str$ = gsn_add_polyline(wks, map, x, y, gres) ;-- add polyline to map
 end do

;-- draw vertical lines
 y := fspan(min(lats),max(lats),numlon) + dy
 do ilon = 0,numlon
    x = lonadd(ilon) + dx
    str = unique_string("gridline")   ;-- create unique name
    map@$str$ = gsn_add_polyline(wks, map, x, y, gres)   ;-- add polyline to map
 end do

end ;-- end procedure draw_data_grid_lines

;------------
;-- Main
;------------
begin
;-- global data: open files and read data
 f1 = addfile("$HOME/data/CMIP5/atmos/orog_fx_MPI-ESM-LR_rcp26_r0i0p0.nc","r")
 var1 = f1->orog(:,:)

 mask1 = addfile("$HOME/data/CMIP5/atmos/sftlf_fx_MPI-ESM-LR_rcp26_r0i0p0.nc","r")
 lsm1 = mask1->sftlf(:,:)
 lsm1 = where(lsm1.gt.0.5,-9999,lsm1)

 lat = f1->lat   ;-- retrieve latitudes
 lon = f1->lon   ;-- retrieve longitudes
 dlat = lat(1)-lat(0)   ;-- lat grid interval
 dlon = lon(1)-lon(0)   ;-- lon grid interval
 nlat1 = dimsizes(lon)  ;-- number of latitudes
 nlon1 = dimsizes(lon)  ;-- number of longitudes

 land_only1 = mask(var1,lsm1,-9999)
 land_only1!0 = "lat"   ;-- named coordinate lat
 land_only1!1 = "lon"   ;-- named coordinate lon
 land_only1&lat = lat   ;-- assign variable lat
 land_only1&lon = lon   ;-- assign variable lon

;-- regional data: open files and read data
 f2 = addfile("$HOME/data/CORDEX/EUR-11/orog_EUR-11_MPI-M-MPI-ESM-LR_historical_r0i0p0_CLMcom-CCLM4-8-17_v1_fx.nc","r")
 var2 = f2->orog(:,:)

 mask2 = addfile("$HOME/data/CORDEX/EUR-11/sftlf_EUR-11_MPI-M-MPI-ESM-LR_historical_r0i0p0_CLMcom-CCLM4-8-17_v1_fx.nc","r")
 lsm2 = mask2->sftlf(:,:)
 lsm2 = where(lsm2.gt.0.5,-9999,lsm2)

 land_only2 = var2
 land_only2 = mask(var2,lsm2,-9999)
 lat2d = f2->lat   ;-- retrieve latitudes
 lon2d = f2->lon   ;-- retrieve longitudes
 nlat = dimsizes(lat2d(:,0))  ;-- number of latitudes
 nlon = dimsizes(lon2d(0,:))  ;-- number of longitudes

;-- open workstation
 wks_type = "png"  ;-- output graphic type
 wks_type@wkBackgroundColor = "grey20"  ;-- background color
 wks_type@wkForegroundColor = "white"  ;-- foreground color
 wks_type@wkWidth = 1500  ;-- workstation width
 wks_type@wkHeight = 1500  ;-- workstation height
 wks = gsn_open_wks(wks_type,"plot_attach_map_to_map_Satellite")

;-- common resources
 res = True
 res@gsnDraw = False   ;-- don't draw plot yet
 res@gsnFrame = False  ;-- don't advance frame

;-- common map resources
 mapres = res
 mapres@vpWidthF = 1.0    ;-- viewport width
 mapres@vpHeightF = 0.85  ;-- viewport height
 mapres@vpXF = 0.08   ;-- start x-position
 mapres@vpYF = 0.90   ;-- start y-position

 mapres@mpDataBaseVersion = "MediumRes"  ;-- map resolution
 mapres@mpProjection = "Satellite"    ;-- map projection

 mapres@mpLimitMode = "angles" ;-- angles represent angular
 mapres@mpLeftAngleF = 25.     ;-- deviation from the line
 mapres@mpRightAngleF = 25.    ;-- of sight from the satellite
 mapres@mpTopAngleF = 25.      ;-- to the projection center
 mapres@mpBottomAngleF = 25.

 mapres@mpCenterLatF = 40. ;-- center latitude
 mapres@mpCenterLonF = 10. ;-- center longitude

 mapres@mpSatelliteAngle1F = 7.*57.2957795130823*asin(1./30.)/8. ;-- 1.671437 to 3.58404
 mapres@mpSatelliteAngle2F = 85.   ;-- orthogonal view
 mapres@mpSatelliteDistF = 2.32    ;-- n-times Earth distance

 mapres@mpLabelsOn = False   ;-- no map labels
 mapres@mpPerimOn = False    ;-- don't draw a box around the map plot
 mapres@mpOutlineOn = True   ;-- draw coastal outlines
 mapres@mpGeophysicalLineThicknessF = 1.7  ;-- line thickness
 mapres@mpGeophysicalLineColor = "grey30"  ;-- line color

;-- map resources for global map
 mpres = mapres
 mpres@mpFillOn = True   ;-- turn map fill on
 mpres@mpFillDrawOrder = "PreDraw"   ;-- draw filled map first
 mpres@mpOceanFillColor = (/ 0.824, 0.961, 1.0 /)   ;-- ocean color
 mpres@mpInlandWaterFillColor = (/ 0.824, 0.961, 1.0 /)   ;-- inland water color
 mpres@mpLandFillColor = (/ 0.7, 0.7, 0.7 /)   ;-- land color

 map = gsn_csm_map(wks,mpres)   ;-- create the global base map
 print("---> global map done")

;-- common contour resources
 cnres = res
 cnres@cnFillOn = True   ;-- turn contour fill on
 cnres@cnFillMode = "RasterFill"   ;-- use raster fill
 cnres@cnMissingValFillColor = "steelblue1"   ;-- missing value color
 cnres@cnLinesOn = False   ;-- don't draw contour lines
 cnres@cnLineLabelsOn = False   ;-- don't draw contour line labels
 cnres@cnInfoLabelOn = False   ;-- don't draw contour info label
 cnres@cnFillPalette = "OceanLakeLandSnow"   ;-- choose color map
 cnres@cnRasterSmoothingOn = False   ;-- do not smooth contouring
 cnres@cnLevelSelectionMode = "ManualLevels"   ;-- use manual levels
 cnres@cnMinLevelValF = -100.0   ;-- minimum contour value
 cnres@cnMaxLevelValF = 3000.   ;-- maximum contour value
 cnres@cnLevelSpacingF = 50.   ;-- contour interval

 cnres@gsnLeftString = "["+var1@units+"]"   ;-- draw units above the labelbar
 cnres@gsnLeftStringOrthogonalPosF = -0.01  ;-- move the left string downward
 cnres@gsnLeftStringParallelPosF = -0.066   ;-- move left string left
 cnres@gsnLeftStringFontHeightF = 0.012     ;-- left string font size
 cnres@gsnRightString = ""   ;-- don't draw right string
 cnres@tiXAxisString = ""    ;-- don't draw x-axis title
 cnres@tiYAxisString = ""    ;-- don't draw y-axis title

 cnres@lbAutoManage = False   ;-- control labelbar manually
 cnres@lbBoxMinorExtentF = 0.2   ;-- smaller labelbar boxes
 cnres@lbOrientation = "vertical"   ;-- labelbar orientation
 cnres@lbLabelFontHeightF = 0.012   ;-- labelbar font size
 cnres@pmLabelBarOrthogonalPosF = -1.225   ;-- move labelbar to the left side of plot
 cnres@pmLabelBarParallelPosF = 0.49   ;-- move labelbar downwards; default: 0.5
 cnres@lbLabelPosition = "left"   ;-- move labels to left side of labelbar
 cnres@lbRightMarginF = -0.28   ;-- move labelbar to the left

;-- contour resources plot1
 cnres1 = cnres
 cnres1@gsnAddCyclic = True   ;-- add cyclic point

 plot1 = gsn_csm_contour(wks,land_only1,cnres1)   ;-- create global plot
 print("---> contour plot1 done")

;-- overlay plot1 on map
 overlay(map,plot1)
 print("---> overlay contour plot1 on global map")

;-- add grid lines from original grid
 draw_data_grid_lines(wks,map,land_only1)   ;-- procedure defined above
 print("---> draw grid lines on global map")

;-- regional contour resources
 cnres2 = cnres
 cnres2@trYReverse = True   ;-- reverse y-axis
 cnres2@tfDoNDCOverlay = False   ;-- transform to standard lat/lon
 cnres2@sfXArray = lon2d   ;-- longitude array
 cnres2@sfYArray = lat2d   ;-- latitude array
 cnres2@lbLabelBarOn = False   ;-- don't draw a labelbar
 cnres2@cnFillDrawOrder = "PostDraw"   ;-- draw last; default: "Draw"

 plot2 = gsn_csm_contour(wks,land_only2,cnres2)   ;-- create Europe plot
 print("---> regional contour plot2 done")

;-- edges for the shadow box and the borderline of plot2
 lon_val_upper = lon2d(nlat-1,:)
 lat_val_upper = lat2d(nlat-1,:)
 lon_val_lower = lon2d(0,:)
 lat_val_lower = lat2d(0,:)
 lon_val_left = lon2d(:,0)
 lat_val_left = lat2d(:,0)
 lon_val_right = lon2d(:,nlon-1)
 lat_val_right = lat2d(:,nlon-1)

;-- draw a "shadow" rectangle around the regional map for better visibility
 dx = 1.5   ;-- x-offset of shadow rectangle
 dy = 1.0   ;-- y-offset of shadow rectangle

;-- x-array for shadow rectangle
 x = array_append_record((/lon_val_lower+dx/), (/lon_val_right+dx/), 0)
 x := array_append_record((/x/), (/lon_val_upper(::-1)+dx/), 0)
 x := array_append_record((/x/), (/lon_val_left(::-1)+dx/), 0)
 x := array_append_record((/x/), (/lon2d(0,0)+dx/), 0)

;-- y-array for shadow rectangle
 y = array_append_record((/lat_val_lower-dy/), (/lat_val_right-dy/), 0)
 y := array_append_record((/y/), (/lat_val_upper(::-1)-dy/), 0)
 y := array_append_record((/y/), (/lat_val_left(::-1)-dy/), 0)
 y := array_append_record((/y/), (/lat2d(0,0)-dy/), 0)

;-- draw the transparent shadow rectangle (filled polygon)
 pgres = True
 pgres@tfPolyDrawOrder = "PostDraw"  ;-- draw the rectangle last
 pgres@gsLineColor = "grey30"   ;-- rectangle line color
 pgres@gsFillColor = "grey30"   ;-- rectangle fill color
 pgres@gsFillOpacityF = 0.7   ;-- light transparency

 shadow = gsn_add_polygon(wks, map, x, y, pgres)   ;-- attach shadow rectangle to map
 print("---> regional plot2 shadow done")

;-- overlay regional plot on map
 overlay(map,plot2)
 print("---> overlay regional plot2 done")

;-- create a simple global map with geophysical outlines only
 mpres2 = mapres
 mpres2@mpGridAndLimbOn = False   ;-- don't draw map grid lines
 mpres2@mpFillOn = False   ;-- don't fill map

 map2 = gsn_csm_map(wks,mpres2) ;-- create simple map
 print("---> simple map2 outlines done")

;-- attach map2 to map to draw the geophysical outlines ontop of the regional map, too.
 anres = True
 anid = gsn_add_annotation(map,map2,anres)   ;-- attach map2 to map
 print("---> add map2 annotation done")

;-- draw the edges of the regional map in black
 plres = True
 plres@tfPolyDrawOrder = "PostDraw"  ;-- draw line last
 plres@gsLineThicknessF = 1.5   ;-- line thickness
 plres@gsLineColor = "grey15"   ;-- line color

 upper = gsn_add_polyline(wks, map2, lon_val_upper, lat_val_upper, plres)   ;-- attach upper line
 lower = gsn_add_polyline(wks, map2, lon_val_lower, lat_val_lower, plres)   ;-- attach lower line
 left = gsn_add_polyline(wks, map2, lon_val_left, lat_val_left, plres)      ;-- attach left line
 right = gsn_add_polyline(wks, map2, lon_val_right, lat_val_right, plres)   ;-- attach right line
 print("---> black rectangle/edge done")

;-- draw the map
 draw(map)

;-- draw manual title on top of the plot
 title = "Overlay: regional on global grid (orography)"  ;-- title string
 tires = True   ;-- text resources copyright string
 tires@txFontColor = "white"     ;-- change to white
 tires@txJust = "CenterCenter"   ;-- text justification
 tires@txFontHeightF = 0.024     ;-- make font size smaller
 tires@txFontThicknessF = 3.0    ;-- thicker font
 gsn_text_ndc(wks,title, 0.6, 0.95, tires)   ;-- plot copyright info

;-- add copyright info string
 txres = True   ;-- text resources copyright string
 txres@txFontColor = "white"    ;-- change to white
 txres@txJust = "BottomRight"   ;-- text justification
 txres@txFontHeightF = 0.013    ;-- make font size smaller
 txres@txFontThicknessF = 3.0   ;-- thicker font
 gsn_text_ndc(wks,"~F35~c ~F21~~N~DKRZ", 0.98, 0.013, txres)  ;-- plot copyright info

;-- advance the frame
 frame(wks)
 print("---> all done")

end
Result: