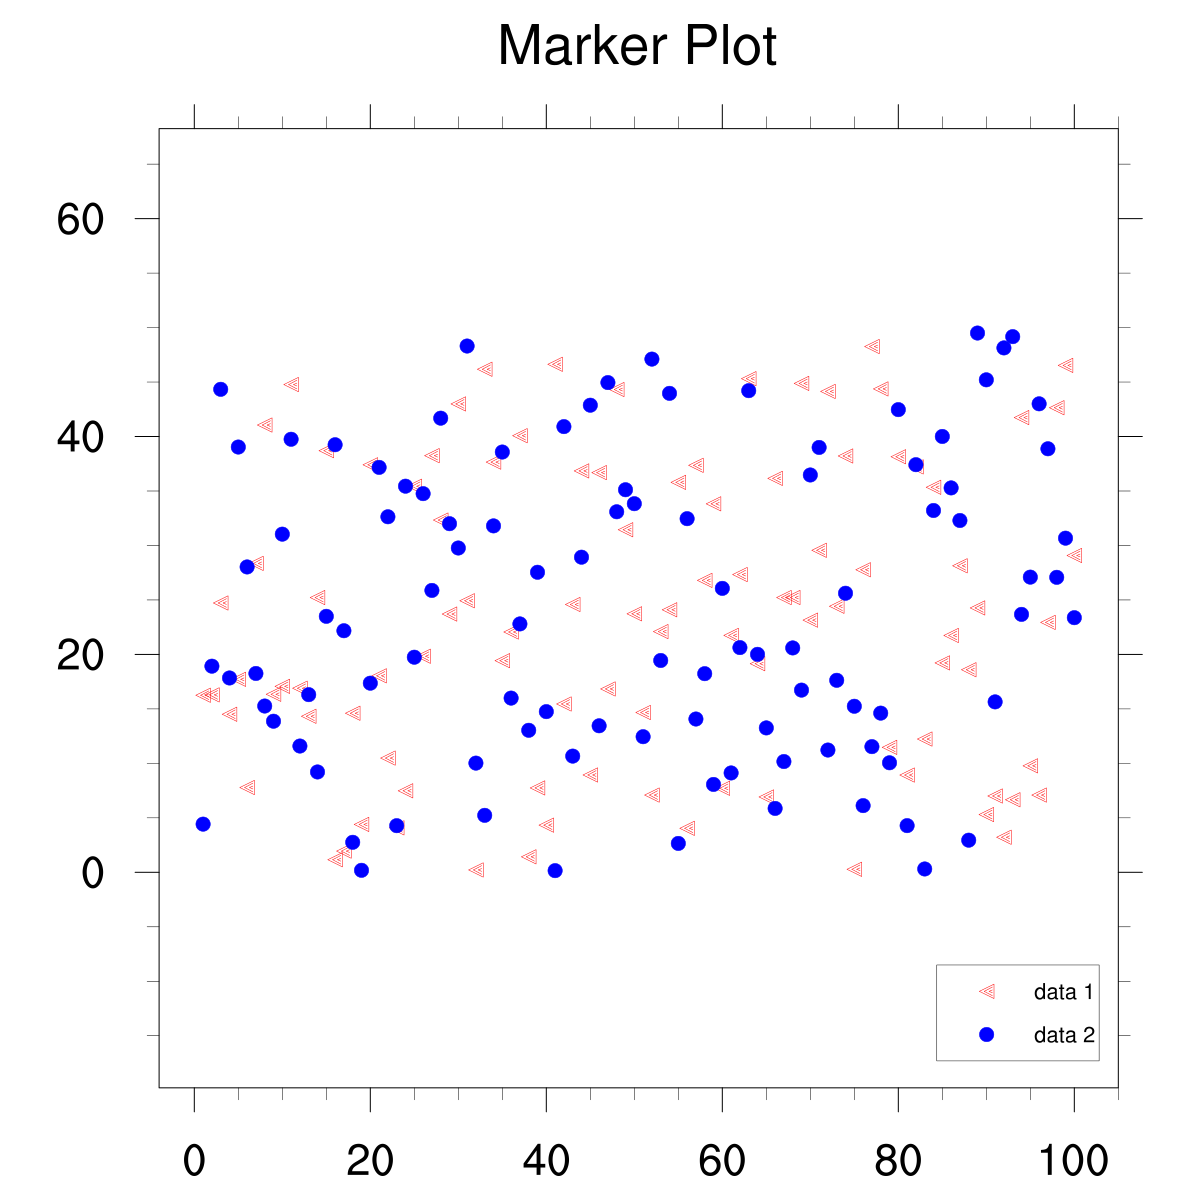
DKRZ NCL scatter plot with legend example#
Example script:
;---------------------------------------------------
; DKRZ NCL example script:  set_xy_markers.ncl
;
; Description:   draw a scatter plot of dummy data
;                - use different markers
;                - use different marker colors
;                - draw legend with markers and labels
;                  inside plot
;
; 07.04.16  kmf
;---------------------------------------------------
begin

  npts    =  100
  data1   =  random_uniform(0.1,50,npts)
  data2   =  random_uniform(0.1,50,npts)
  x       =  ispan(1,npts,1)

  print("min/max data = " + min(data1) + "/" + max(data1))
  print("min/max data = " + min(data2) + "/" + max(data2))

;-- create data array containing data1 and data2
  data = new((/2,npts/),typeof(data1))
  data(0,:) =  data1
  data(1,:) =  data2

;-- set explicit labels for legend
  labels = (/"data 1","data 2"/)

;-- open workstation
  wks_type = "png"
  wks_type@wkWidth  = 1200
  wks_type@wkHeight = 1200
  wks = gsn_open_wks(wks_type,"plot_xy_markers")

;-- set resources
  res                        =  True
  res@gsnMaximize            =  True                     ;-- maximize plot output

  res@tiMainString           = "Marker Plot"             ;-- add title

  res@trYMinF                =  min(data1)-20.           ;-- y-axis minimum to have enough space for legend
  res@trYMaxF                =  max(data1)+20.           ;-- y-axis maximum
  res@trXMinF                =  min(x)-5.                ;-- y-axis minimum to have enough space for legend
  res@trXMaxF                =  max(x)+5.                ;-- y-axis maximum

  res@tmLabelAutoStride      =  True                     ;-- use nice tick mark labels

  res@xyMarkLineModes        = (/"Markers","Markers"/)   ;-- set mark line mode for both variables
  res@xyMarkers              = (/ 10, 16/)               ;-- choose marker types
  res@xyMarkerColors         = (/"red","blue"/)          ;-- choose marker colors

  res@lgJustification        = "TopRight"                ;-- position of legend
  res@lgLabelFontHeightF     =  0.01                     ;-- legend label font size
  res@lgItemOrder            = (/1,0/)                   ;-- reverse the legend
  res@xyExplicitLabels       =  labels                   ;-- use explicit legend labels

  res@pmLegendDisplayMode    = "Always"                  ;-- display legend always
  res@pmLegendWidthF         =  0.10                     ;-- legend width
  res@pmLegendHeightF        =  0.06                     ;-- legend height
  res@pmLegendOrthogonalPosF = -0.22                     ;-- move legend up
  res@pmLegendParallelPosF   =  0.98                     ;-- move legend right

;-- create the plot
  plot = gsn_csm_xy(wks,x,data,res)

end
Result: