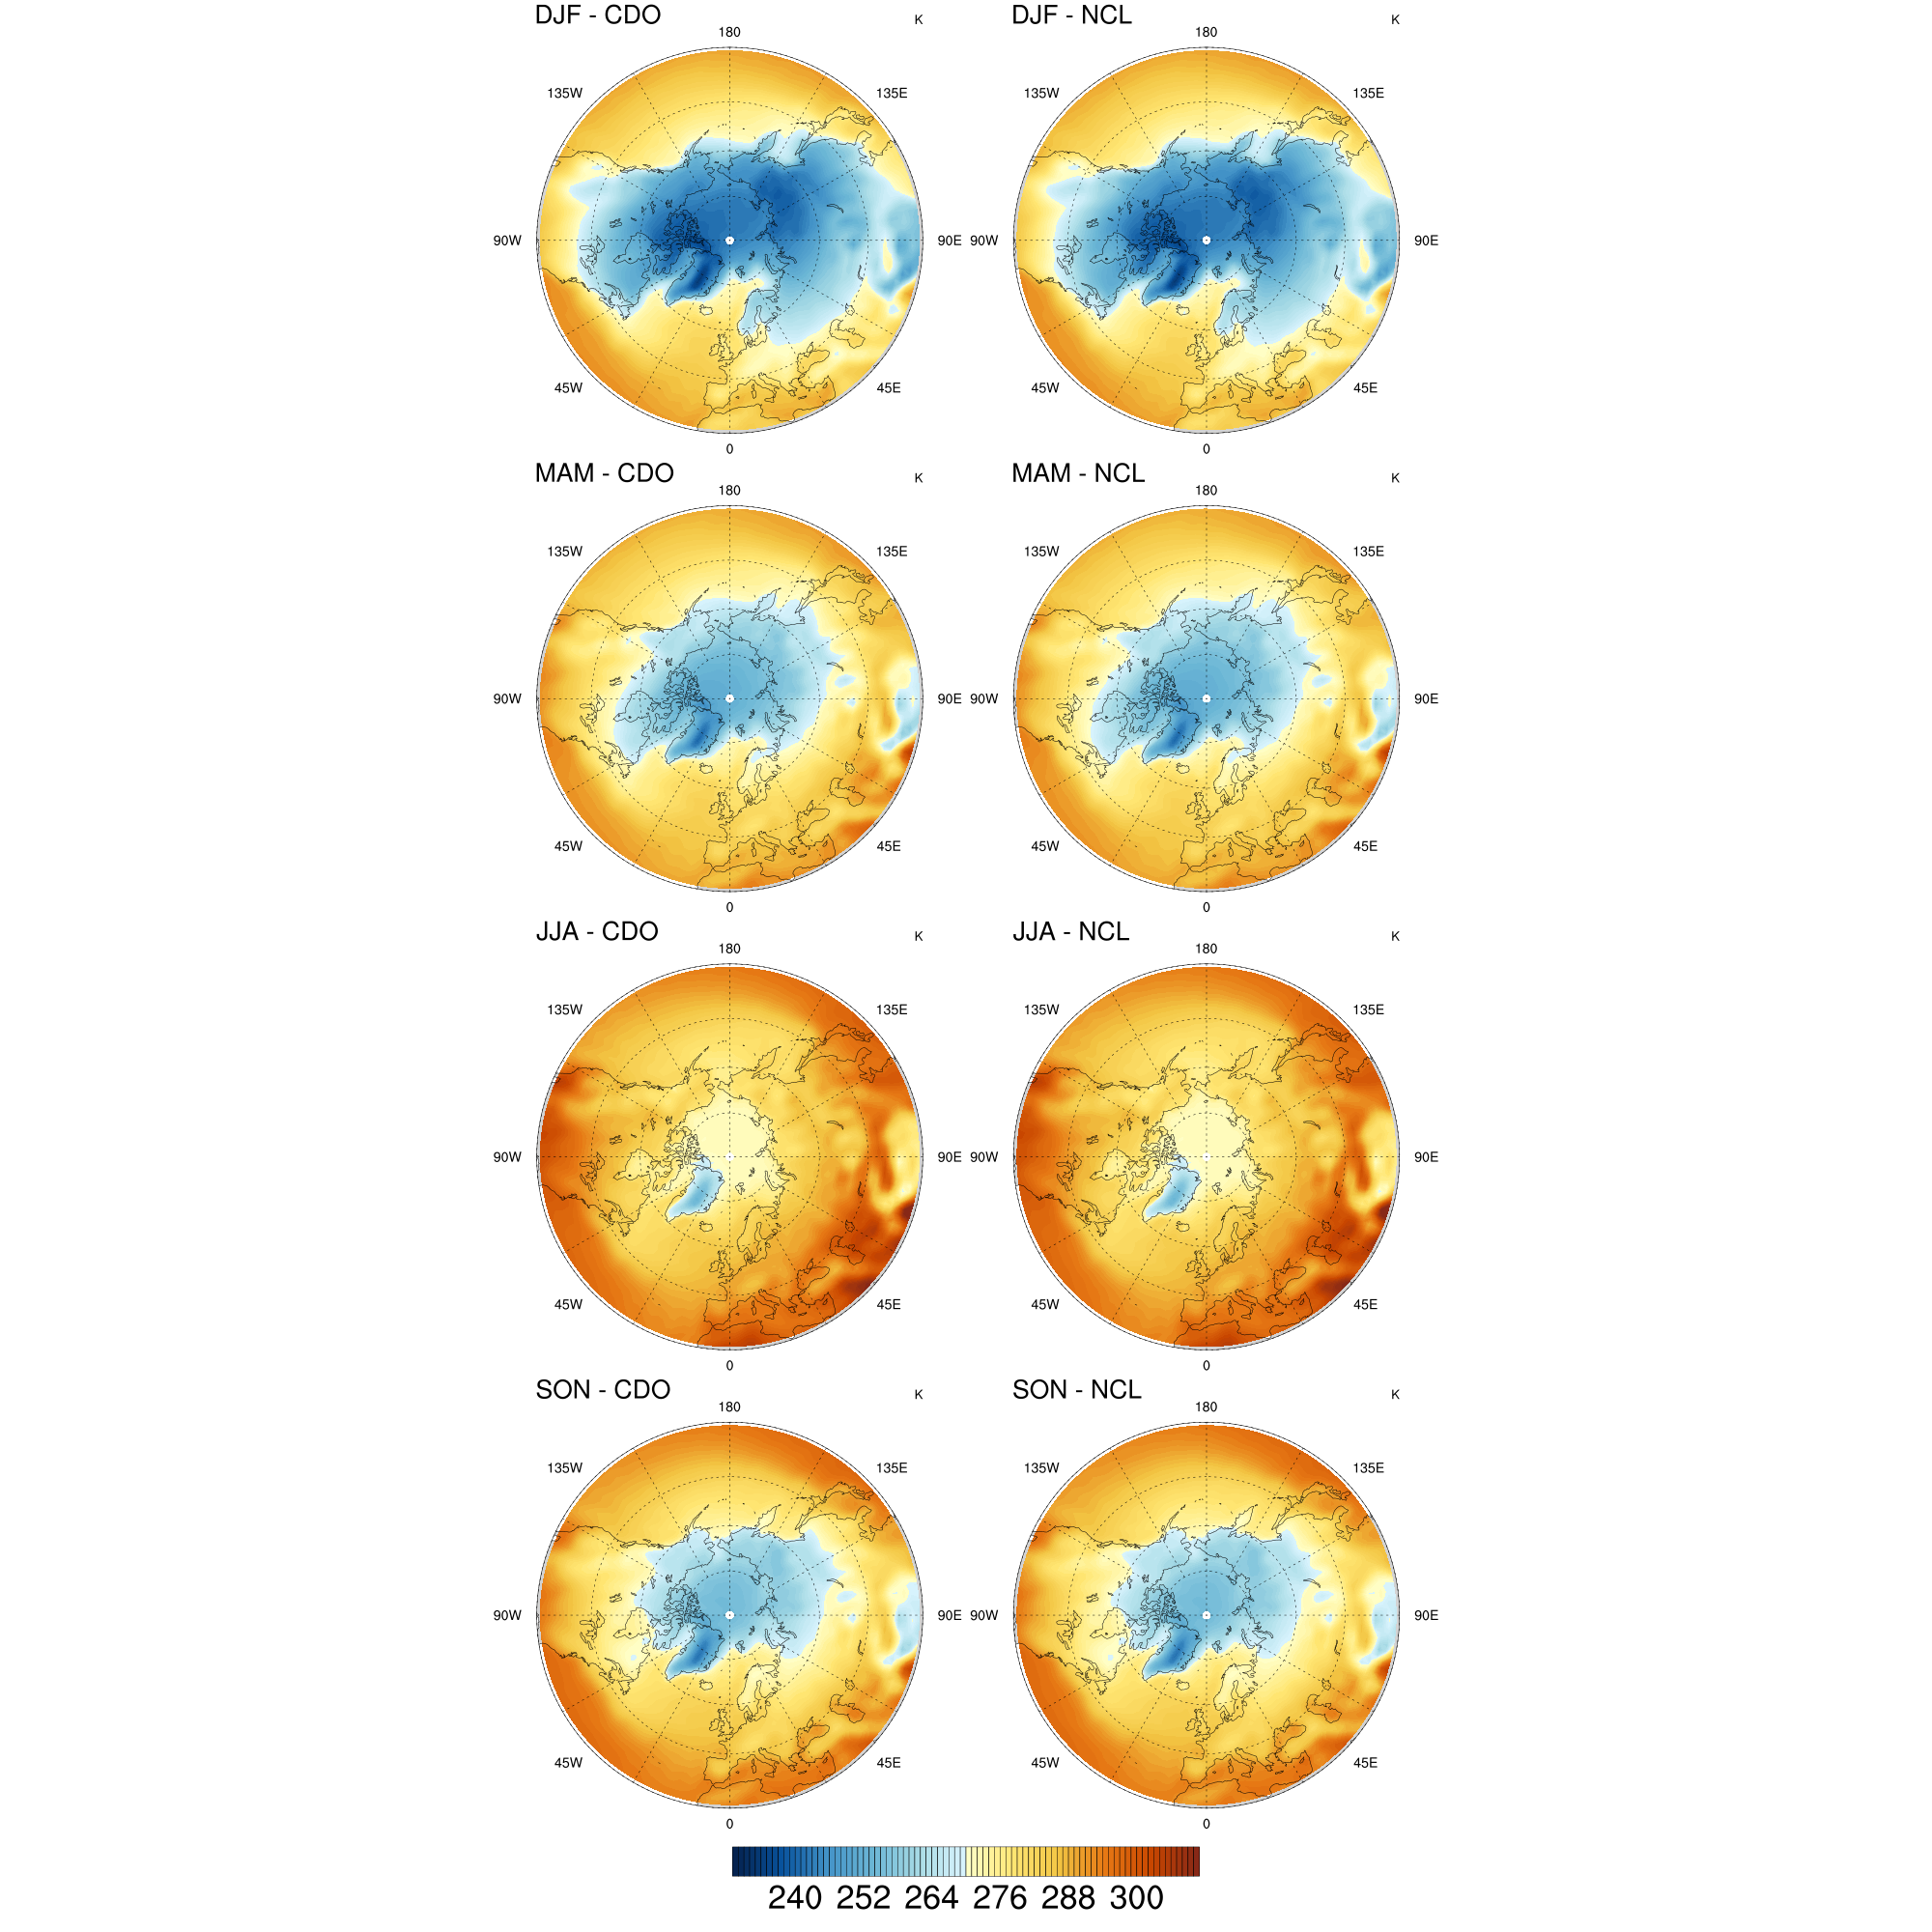
DKRZ NCL seasons comparison with CDO seasons#
Example script:
;--------------------------------------------------------------------
; DKSR NCL example:  compute_seasons_compare_CDO_and_NCL.ncl
;
; Description:   compare CDO and NCL seasons
;
; 08.06.18 kmf
;--------------------------------------------------------------------
begin

 diri = "data/CMIP5/atmos/"
 fili = "tas_Amon_MPI-ESM-LR_historical_r3i1p1_185001-200512.nc"

;-- open file and read variable
 inf = addfile(diri+fili,"r")
 var = inf->tas

;-- CDO compute seasons - compute "DJF","MAM","JJA","SON"
 system("cdo -O -seasmean "+diri+fili+" cdo_outfile.nc")

 f = addfile("cdo_outfile.nc","r")
 var1c = f->tas(0::4,:,:)
 var2c = f->tas(1::4,:,:)
 var3c = f->tas(2::4,:,:)
 var4c = f->tas(3::4,:,:)

;-- average over time
 v1c = dim_avg_n_Wrap(var1c(:,{30:90},:),0)
 v2c = dim_avg_n_Wrap(var2c(:,{30:90},:),0)
 v3c = dim_avg_n_Wrap(var3c(:,{30:90},:),0)
 v4c = dim_avg_n_Wrap(var4c(:,{30:90},:),0)

;-- NCL compute seasons - DJF, MAM, JJA, SON
 seas = month_to_seasonN(var,(/"DJF","MAM","JJA","SON"/))

;-- average over time
 v1n = dim_avg_n_Wrap(seas(0,:,{30:90},:),0)
 v2n = dim_avg_n_Wrap(seas(1,:,{30:90},:),0)
 v3n = dim_avg_n_Wrap(seas(2,:,{30:90},:),0)
 v4n = dim_avg_n_Wrap(seas(3,:,{30:90},:),0)

;-- open workstation
 wks_type = "png"
 wks_type@wkWidth = 2000
 wks_type@wkHeight = 2000
 wks = gsn_open_wks(wks_type,"plot_seasmean_compare_CDO_and_NCL")

;-- set resources
 res = True
 res@gsnDraw = False
 res@gsnFrame = False
 res@gsnLeftString = ""
 res@gsnLeftStringFontHeightF = 0.03

 res@gsnPolar = "NH"
 res@gsnPolarLabelDistance = 1.1 ;-- default dist. is 1.04
 res@gsnPolarLabelFontHeightF = 0.015
 res@gsnPolarLabelSpacing = 45.0 ;-- how frequently to label
 res@gsnPolarLabelDistance = 1.08 ;-- default is 1.04
 res@gsnPolarLabelFontHeightF = 0.025 ;-- change font height of labels
 res@gsnPolarLabelFontHeightF = 0.016

 res@mpMinLatF = 30 ;-- minimum lat to plot
 res@mpCenterLonF = 0 ;-- center longitude

 res@cnFillOn = True
 res@cnLineLabelsOn = False
 res@cnLinesOn = False
 res@cnFillPalette = "BlueYellowRed"
 res@cnLevelSelectionMode = "ManualLevels"
 res@cnMinLevelValF = 230.0 ;-- contour min. value
 res@cnMaxLevelValF = 310.0 ;-- contour max. value
 res@cnLevelSpacingF = 1.0 ;-- contour interval

 res@lbLabelBarOn = False

;-- create each single plot
 res@gsnLeftString = "DJF - CDO"
 plot1 = gsn_csm_contour_map_polar(wks,v1c,res)
 res@gsnLeftString = "DJF - NCL"
 plot2 = gsn_csm_contour_map_polar(wks,v1n,res)

 res@gsnLeftString = "MAM - CDO"
 plot3 = gsn_csm_contour_map_polar(wks,v2c,res)
 res@gsnLeftString = "MAM - NCL"
 plot4 = gsn_csm_contour_map_polar(wks,v2n,res)

 res@gsnLeftString = "JJA - CDO"
 plot5 = gsn_csm_contour_map_polar(wks,v3c,res)
 res@gsnLeftString = "JJA - NCL"
 plot6 = gsn_csm_contour_map_polar(wks,v3n,res)

 res@gsnLeftString = "SON - CDO"
 plot7 = gsn_csm_contour_map_polar(wks,v4c,res)
 res@gsnLeftString = "SON - NCL"
 plot8 = gsn_csm_contour_map_polar(wks,v4n,res)

;-- create the panel plot
 pres = True
 pres@gsnPanelLabelBar = True ;-- add common colorbar

 gsn_panel(wks,(/plot1,plot2,plot3,plot4,plot5,plot6,plot7,plot8/),(/4,2/),pres)

end
Result: