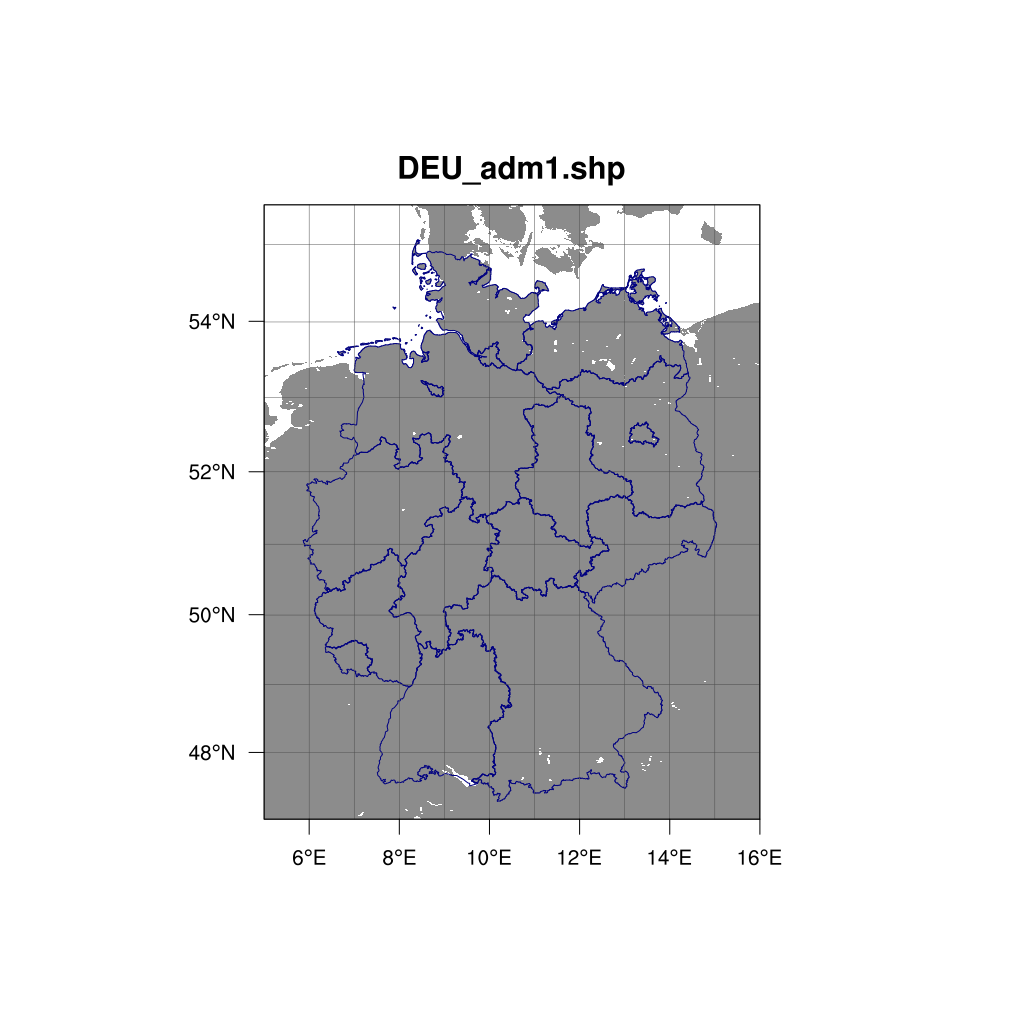
DKRZ NCL shapefile German federal states example#
DKRZ NCL script:
;-----------------------------------------------------------------
;
;  NCL Doc Example:  NCL_shapefile_German_federal_states.ncl
;
;     - create a simple map with the polylines of the shapefile
;
;  30.10.14 kmf
;-----------------------------------------------------------------
begin
  shp_dir  = "./DEU_adm/"
  shp_name = "DEU_adm1.shp"

  wks = gsn_open_wks("png","plot_shapefile_German_fed_states")    ;--open a workstation

  res                       =  True                 ;-- set plot resources
  res@gsnDraw               =  False                ;-- don't draw plot yet
  res@gsnFrame              =  False                ;-- don't advance frame

  res@mpProjection          = "Mercator"            ;-- choose projection
  res@mpLimitMode           = "Corners"             ;-- map limit mode
  res@mpLeftCornerLatF      =  47                   ;-- min lat
  res@mpRightCornerLatF     =  55.5                 ;-- max lat
  res@mpLeftCornerLonF      =  5.                   ;-- min lon
  res@mpRightCornerLonF     =  16.                  ;-- max lon
  res@mpOutlineOn           =  False                ;-- don't draw the map outlines
  res@mpGridAndLimbOn       =  True                 ;-- draw grid lines
  res@mpGridLineColor       = "gray30"              ;-- grid line color
  res@mpGridLonSpacingF     =  1.                   ;-- lon grid spacing
  res@mpGridLatSpacingF     =  1.                   ;-- lat grid spacing
  res@mpGeophysicalLineColor = "black"              ;-- outline color
  res@mpGeophysicalLineThicknessF = 1.0             ;-- thickness of continental outlines
  res@mpDataBaseVersion     = "HighRes"             ;-- high resolution database
  res@mpDataResolution      = "Fine"                ;-- high resolution map
  res@mpLandFillColor       = "gray55"              ;-- land fill color dark gray

  res@pmTickMarkDisplayMode = "Always"              ;-- nice tickmarks
  res@tiMainString          =  shp_name             ;-- title string

  plot = gsn_csm_map(wks,res)                       ;-- create the map

;-- set shapefile resources
  shpres                    =  True                 ;-- set line resources
  shpres@gsLineThicknessF   =  2.0                  ;-- line thickness
  shpres@gsLineColor        = "NavyBlue"            ;-- line color

  id = gsn_add_shapefile_polylines(wks,plot,shp_dir+shp_name,shpres)  ;-- draw the polylines

  draw(plot)            ;-- draw the plot
  frame(wks)            ;-- advance the frame

end
Result: