DKRZ NCL shapefile mean temperature change German coast example#
DKRZ NCL script:
;----------------------------------------------------------------------
; DKRZ NCL Examples: NCL_shapefile_mean_temp_change_German_coast.ncl
;
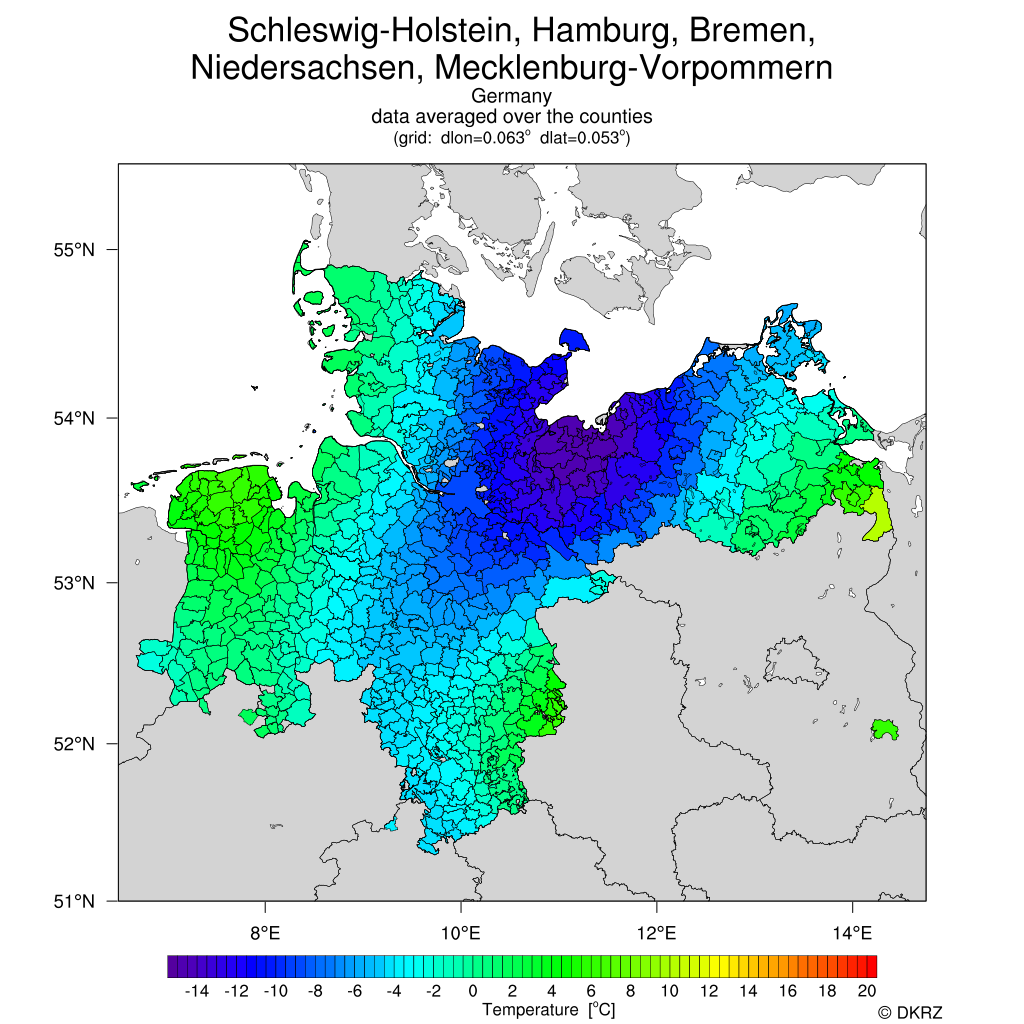
; Description: Average "dummy" data over all counties of a selected
; state of Germany and plot them on a map of Germany.
;
; Library file: $HOME/NCL/lib/lib_shapefiles.ncl
;
; Usage: ncl <arguments> DEU_adm3_avg_over_counties_plus_borderlines.ncl
;
; Arguments: state_name=<string> ;-- default: "Schleswig-Holstein"
; county_border=<True or False> ;-- default: True
; states_border=<True or False> ;-- default: True
; country_border=<True or False> ;-- default: True
; subregion="minlon,maxlon,minlat,maxlat" ;-- default: no sub-region
; Examples:
;
; 1. Draw "Schleswig-Holstein (default) and plot only the sub-region
;
; ncl 'subregion="7.8,11.9,53.0,55.3"' DEU_adm3_avg_over_ALL_counties_plus_borderlines.ncl
;
; 2. Draw "Schleswig-Holstein (default) but don't draw the border of all states
;
; ncl 'states_border=False' DEU_adm3_avg_over_ALL_counties_plus_borderlines.ncl
;
; 3. Select the state "Hessen" but don't draw the borderline of Germany
;
; ncl 'state_name="Hessen"' 'country_border=False' DEU_adm3_avg_over_ALL_counties_plus_borderlines.ncl
;
; 4. Coastal region
; ncl 'subregion="6.5,14.75,50.,55.5"' DEU_adm3_avg_over_ALL_counties_plus_borderlines.ncl
;
; 26.02.14 kmf
;----------------------------------------------------------------------
load "$NCARG_ROOT/lib/ncarg/nclscripts/csm/shea_util.ncl"
;----------------------------------------------------------------------
;-- Function: add_shapefile_polygons(...)
;-- -> add polygons of the selected segments of the
;-- shapefile to the plot
;----------------------------------------------------------------------
undef("add_shapefile_polygons")
;----------------------------------------------------------------------
function add_shapefile_polygons(wks,plot,state_name,colors,f,gnres)
;----------------------------------------------------------------------
local f, segments, geometry, segsDims, geomDims, geom_segIndex, \
geom_numSegs, segs_xyzIndex, segs_numPnts, numFeatures, i, lat, lon, \
startSegment, numSegments, seg, startPT, endPT, npoly, npl
begin
;-- some error handling
if(ismissing(f)) then
print("Error: add_shapefile_polygons: Can't open shapefile '" + fname + "'")
return(new(1,graphic))
end if
if(f@geometry_type.ne."polygon") then
print("Error: add_shapefile_polygons: Attribute geometry_type must be 'polygon'")
return(new(1,graphic))
end if
;-- read shapefile data
segments = f->segments
geometry = f->geometry
segsDims = dimsizes(segments)
geomDims = dimsizes(geometry)
lon = f->x ;-- longitudes array of counties
lat = f->y ;-- latitudes array of counties
geom_segIndex = f@geom_segIndex
geom_numSegs = f@geom_numSegs
segs_xyzIndex = f@segs_xyzIndex
segs_numPnts = f@segs_numPnts
numFeatures = geomDims(0)
;-- create array to hold all polylines
npoly = sum(geometry(:,geom_numSegs)) ;-- sum of all counties polygons
poly = new(npoly,graphic) ;-- array of all counties polygons
npl = 0 ;-- polyline counter
j = 0 ;-- counter for the colors array
;-- draw the color filled polygons
do i=0, numFeatures-1
startSegment = geometry(i, geom_segIndex)
numSegments = geometry(i, geom_numSegs)
do seg=startSegment, startSegment+numSegments-1
startPT = segments(seg, segs_xyzIndex)
endPT = startPT + segments(seg, segs_numPnts) - 1
gnres@gsFillColor = colors(j) ;-- set color
gnres@tfPolyDrawOrder = "PostDraw"
poly(npl) = gsn_add_polygon (wks, plot, lon(startPT:endPT),lat(startPT:endPT), gnres)
npl = npl + 1
end do
j=j+1
end do
return(poly) ;-- return the polygon array
end
;----------------------------------------------------------------------
;-- Function: add_shapefile_polylines(...)
;-- -> add polylines of the selected segments of the
;-- shapefile to the plot
;----------------------------------------------------------------------
undef("add_shapefile_polylines")
;----------------------------------------------------------------------
function add_shapefile_polylines(wks,plot,state_name,colors,f,gnres)
;----------------------------------------------------------------------
local f, segments, geometry, segsDims, geomDims, geom_segIndex, \
geom_numSegs, segs_xyzIndex, segs_numPnts, numFeatures, i, lat, lon, \
startSegment, numSegments, seg, startPT, endPT, npoly, npl
begin
;-- some error handling
if(ismissing(f)) then
print("Error: add_shapefile_polys: Can't open shapefile '" + fname + "'")
return(new(1,graphic))
end if
if(f@geometry_type.ne."polygon") then
print("Error: add_shapefile_polys: Attribute geometry_type must be 'polygon'")
return(new(1,graphic))
end if
;-- read shapefile data
segments = f->segments
geometry = f->geometry
segsDims = dimsizes(segments)
geomDims = dimsizes(geometry)
lon = f->x ;-- longitudes array of counties
lat = f->y ;-- latitudes array of counties
geom_segIndex = f@geom_segIndex
geom_numSegs = f@geom_numSegs
segs_xyzIndex = f@segs_xyzIndex
segs_numPnts = f@segs_numPnts
numFeatures = geomDims(0)
;-- grab the indices containing the counties of the selected state
states = f->NAME_1
names3 = f->NAME_3
DEU_counties = ind(names3.ne."")
;-- get state_name counties
wc=new(dimsizes(names3),typeof(names3))
if(.not.isatt(wc,"_FillValue")) then
wc@_FillValue = default_fillvalue(typeof(names3)) ;-- make sure "wc" has a missing value
end if
n=0
do m=0,dimsizes(names3)-1
if(states(m).eq.state_name) then
wc(n) = names3(m) ;-- get all relevant counties
else
wc(n) = default_fillvalue(typeof(names3)) ;-- set all other to missing value
end if
n=n+1
end do
wcounties = ind(.not. ismissing(wc))
state_counties = new(dimsizes(wcounties),string)
do jj=0,dimsizes(wcounties)-1
state_counties(jj) = names3(wcounties(jj)) ;-- get the names of the relevant counties
end do
;-- create array to hold all polylines
npoly = sum(geometry(:,geom_numSegs)) ;-- sum of all counties polygons
poly = new(npoly,graphic) ;-- array of all counties polygons
npl = 0 ;-- polyline counter
j = 0 ;-- counter for the colors array
;-- draw the color filled polygons
do i=0, dimsizes(DEU_counties)-1
do ll=0, dimsizes(wcounties)-1
if(names3(i) .eq. state_counties(ll)) then
print("Draw county outline: "+names3(i))
startSegment = geometry(i, geom_segIndex)
numSegments = geometry(i, geom_numSegs)
do seg=startSegment, startSegment+numSegments-1
startPT = segments(seg, segs_xyzIndex)
endPT = startPT + segments(seg, segs_numPnts) - 1
gnres@gsLineColor = "black"
gnres@tfPolyDrawOrder = "PostDraw"
poly(npl) = gsn_add_polyline(wks, plot, lon(startPT:endPT),lat(startPT:endPT), gnres)
npl = npl + 1
end do
j=j+1
end if
end do
end do
return(poly) ;-- return the polygon array
end
;----------------------------------------------------------------------
;-- Function: avg_by_county(...)
;-- -> compute the average of the data for each county
;--------------------------------------------------------------------
undef("avg_by_county")
;--------------------------------------------------------------------
function avg_by_county(wks,plot,data,f,state_name,wcounties,levels,colors)
;--------------------------------------------------------------------
local f, segments, geometry, segsDims, geomDims, geom_segIndex, geom_numSegs, segs_xyzIndex, \
segs_numPnts, numFeatures, i, lat, lon, startSegment, numSegments, seg, \
startPT, endPT, dims, minlat, maxlat, minlon, maxlon
begin
getvalues plot
"mpLeftCornerLatF" : minlat ;-- retrieve map min lat
"mpRightCornerLatF" : maxlat ;-- retrieve map max lat
"mpLeftCornerLonF" : minlon ;-- retrieve map min lon
"mpRightCornerLonF" : maxlon ;-- retrieve map max lon
end getvalues
;-- read shapefile data
geomDims = getfilevardimsizes(f,"geometry")
numFeatures = geomDims(0)
segments = f->segments
geometry = f->geometry
segsDims = dimsizes(segments)
geom_segIndex = f@geom_segIndex
geom_numSegs = f@geom_numSegs
segs_xyzIndex = f@segs_xyzIndex
segs_numPnts = f@segs_numPnts
lat = f->y
lon = f->x
dims = dimsizes(data)
nlat = dims(0)
nlon = dims(1)
lat1d = ndtooned(conform_dims((/nlat,nlon/),data&lat,0))
lon1d = ndtooned(conform_dims((/nlat,nlon/),data&lon,1))
nlatlon = dimsizes(lat1d)
ii_latlon = ind(lat1d.ge.minlat.and.lat1d.le.maxlat.and.lon1d.ge.minlon.and.lon1d.le.maxlon)
nii_latlon = dimsizes(ii_latlon)
;-- grab the indexes containing the counties
states = f->NAME_1 ;-- state names reference
names3 = f->NAME_3 ;-- county names copied from DEU_adm3.shp
DEU_counties = ind(names3.ne."") ;-- read all county names
;-- get state_name counties
wc=new(dimsizes(names3),typeof(names3))
if(.not.isatt(wc,"_FillValue")) then
wc@_FillValue = default_fillvalue(typeof(names3)) ;-- make sure "wc" has a missing value
end if
n=0
do m=0,dimsizes(names3)-1
if(states(m).eq.state_name) then
wc(n) = names3(m) ;-- get all relevant counties
else
wc(n) = default_fillvalue(typeof(names3)) ;-- set all other to missing value
end if
n=n+1
end do
wcounties = ind(.not. ismissing(wc))
state_counties = new(dimsizes(wcounties),string)
do jj=0,dimsizes(wcounties)-1
state_counties(jj) = names3(wcounties(jj)) ;-- get the names of the relevant counties
end do
;-- create array to hold new data mask and averaged data
data_mask_1d = new(nlatlon,integer)
if(.not.isatt(data,"_FillValue")) then
data@_FillValue = default_fillvalue(typeof(data)) ;-- make sure "data" has a missing value
end if
data_1d = ndtooned(data) ;-- convert data to 1D array
data_avg = new(dimsizes(DEU_counties),typeof(data),data@_FillValue)
gnres = True ;-- polygon resource list
nfill = dimsizes(colors)
do i=0,dimsizes(DEU_counties)-1
do ll=0,dimsizes(wcounties)-1
if (names3(i) .eq. state_counties(ll)) then
data_mask_1d = 0 ; Be sure to reset to 0 for every county
startSegment = geometry(DEU_counties(i), geom_segIndex)
numSegments = geometry(DEU_counties(i), geom_numSegs)
do seg=startSegment, startSegment+numSegments-1
startPT = segments(seg, segs_xyzIndex)
endPT = startPT + segments(seg, segs_numPnts) - 1
do n=0,nii_latlon-1
nn = ii_latlon(n) ; Get index of point we're checking
if(lat1d(nn).lt.min(lat(startPT:endPT)).or.lat1d(nn).gt.max(lat(startPT:endPT)).or.\
lon1d(nn).lt.min(lon(startPT:endPT)).or.lon1d(nn).gt.max(lon(startPT:endPT)))
continue
end if
if(gc_inout(lat1d(nn),lon1d(nn),lat(startPT:endPT),lon(startPT:endPT))) then
data_mask_1d(nn) = 1 ; This point is inside this county
end if
end do
end do
ndm = num(data_mask_1d.eq.1)
;-- calculate the averages
if(ndm.gt.0) then
data_avg(i) = avg(where(data_mask_1d.eq.1,data_1d,data_1d@_FillValue))
print("-----------------------------------------------------------------")
print((ll+1)+": Inspecting "+state_name+" county '" + names3(DEU_counties(i)) + "'...")
print(" "+ndm + " data values found --> average = " + data_avg(i))
end if
end if
end do
end do
return(data_avg) ;-- return data averages for each county
end
;----------------------------------------------------------------------
;-- Function: avg_by_state(...)
;-- -> compute the average of the data for each state
;--------------------------------------------------------------------
undef("avg_by_state")
;--------------------------------------------------------------------
function avg_by_state(wks,plot,data,shpf,state_names,levels,colors)
;--------------------------------------------------------------------
local segments, geometry, segsDims, geomDims, geom_segIndex, geom_numSegs, segs_xyzIndex, \
segs_numPnts, numFeatures, i, lat, lon, startSegment, numSegments, seg, \
startPT, endPT, dims, minlat, maxlat, minlon, maxlon
begin
getvalues plot
"mpLeftCornerLatF" : minlat
"mpRightCornerLatF" : maxlat
"mpLeftCornerLonF" : minlon
"mpRightCornerLonF" : maxlon
end getvalues
;-- read shapefile data
geomDims = getfilevardimsizes(shpf,"geometry")
numFeatures = geomDims(0)
segments = shpf->segments
geometry = shpf->geometry
segsDims = dimsizes(segments)
geom_segIndex = shpf@geom_segIndex
geom_numSegs = shpf@geom_numSegs
segs_xyzIndex = shpf@segs_xyzIndex
segs_numPnts = shpf@segs_numPnts
lat = shpf->y
lon = shpf->x
dims = dimsizes(data)
nlat = dims(0)
nlon = dims(1)
lat1d = ndtooned(conform_dims((/nlat,nlon/),data&lat,0))
lon1d = ndtooned(conform_dims((/nlat,nlon/),data&lon,1))
nlatlon = dimsizes(lat1d)
ii_latlon = ind(lat1d.ge.minlat.and.lat1d.le.maxlat.and.lon1d.ge.minlon.and.lon1d.le.maxlon)
nii_latlon = dimsizes(ii_latlon)
;-- grab the indexes containing the states
names1 = state_names ;-- state names copied from DEU_adm1.shp
ga_states = ind(names1.ne."")
;-- create array to hold new data mask and averaged data
data_mask_1d = new(nlatlon,integer)
if(.not. isatt(data,"_FillValue")) then
data@_FillValue = default_fillvalue(typeof(data)) ;-- make sure "data" has a missing value
end if
data_1d = ndtooned(data) ;-- this is for the averages computation later
data_avg = new(dimsizes(ga_states),typeof(data),data@_FillValue)
;-- array to hold data averages for each state
gnres = True ;-- polygon resource list
nfill = dimsizes(colors)
do i=0, dimsizes(ga_states)-1
data_mask_1d = 0 ;-- be sure to reset to 0 for every state
startSegment = geometry(ga_states(i), geom_segIndex)
numSegments = geometry(ga_states(i), geom_numSegs) ;-- some states have multiple segments
do seg=startSegment, startSegment+numSegments-1
startPT = segments(seg, segs_xyzIndex)
endPT = startPT + segments(seg, segs_numPnts) - 1
do n=0,nii_latlon-1 ;-- loop through each point if it's in this state
nn = ii_latlon(n) ;-- get index of point we're checking
;-- don't check this point if it doesn't fall within this state
if(lat1d(nn).lt.min(lat(startPT:endPT)).or.lat1d(nn).gt.max(lat(startPT:endPT)).or.\
lon1d(nn).lt.min(lon(startPT:endPT)).or.lon1d(nn).gt.max(lon(startPT:endPT)))
continue
end if
if(gc_inout(lat1d(nn),lon1d(nn),lat(startPT:endPT),lon(startPT:endPT))) then
data_mask_1d(nn) = 1 ;-- this point is inside this state
end if
end do
end do
ndm = num(data_mask_1d.eq.1) ;-- count number of points found in this state
;-- compute the averages
if(ndm.gt.0) then
data_avg(i) = avg(where(data_mask_1d.eq.1,data_1d,data_1d@_FillValue))
print("-----------------------------------------------------------------")
print((i+1)+": Inspecting Germany state '" + names1(ga_states(i)) + "'...")
end if
print(" "+ndm + " data values found --> average = " + data_avg(i))
end do
return(data_avg) ;-- return data averages for each state
end
;----------------------------------------------------------------------
;-- MAIN
;----------------------------------------------------------------------
begin
start_date = toint(systemfunc("date +%s"))
state_name = (/"Schleswig-Holstein","Hamburg","Bremen", "Niedersachsen","Mecklenburg-Vorpommern"/)
print("")
print("Selected state of Germany: "+state_name)
print("")
mminlat = 51.0
mmaxlat = 55.5
mminlon = 6.5
mmaxlon = 14.75
country_border = True ;-- default: draw country border line
states_border = True ;-- default: draw states border lines
counties_border = True ;-- default: draw counties border lines
subregion = True
;-- shapefile containing Germany states and counties
shapefile_dir = "$HOME/data/Shapefiles/DEU_adm/" ;-- directory containing the shapefiles
shp_name = "DEU_adm3.shp" ;-- shapefile to be used
shp_fname = shapefile_dir+shp_name ;-- path of shapefile
shpf3 = addfile(shp_fname,"r") ;-- open shapefile
county_names = shpf3->NAME_3 ;-- county names
states = shpf3->NAME_1 ;-- state names
shplon = shpf3->x ;-- longitudes
shplat = shpf3->y ;-- latitudes
;-- Germany borderline coordinates
DEU_minlat = min(shplat)-0.1
DEU_maxlat = max(shplat)+0.1
DEU_minlon = min(shplon)-0.1
DEU_maxlon = max(shplon)+0.1
;-- generate dummy data (we need higher resolution for regional sections)
nlat = 150 ;-- number of lat values
nlon = 150 ;-- number of lon values
lat = fspan(DEU_minlat,DEU_maxlat,nlat) ;-- generate lat dimension data
lon = fspan(DEU_minlon,DEU_maxlon,nlon) ;-- generate lon dimension data
lat@units = "degrees_north" ;-- lat dimension units attribute
lon@units = "degrees_east" ;-- lon dimension units attribute
var = generate_2d_array(25,25,-15,20,100,(/nlat,nlon/)) ;-- generate dummy data
var!0 = "lat" ;-- data lat dimension name
var!1 = "lon" ;-- data lon dimension name
var&lat = lat ;-- lat dimension data
var&lon = lon ;-- lon dimension data
var@units = "C" ;-- data units
var@_FillValue = -9999.9
delta_x = (DEU_maxlon-DEU_minlon)/nlon
delta_y = (DEU_maxlat-DEU_minlat)/nlat
;-- open a workstation
wks = gsn_open_wks("png","plot_DEU_adm3_avg_over_counties_COAST")
;-- set resources
res = True
res@gsnDraw = False ;-- don't draw plot yet
res@gsnFrame = False ;-- don't advance frame
res@gsnAddCyclic = False ;-- no cyclic point
res@gsnRightString = ""
res@mpProjection = "Mercator" ;-- use Mercator projection
res@mpLimitMode = "Corners" ;-- map limit mode
if(isvar("subregion")) then ;-- is 'subregion' on command line?
res@mpLeftCornerLatF = mminlat ;-- min lat
res@mpRightCornerLatF = mmaxlat ;-- max lat
res@mpLeftCornerLonF = mminlon ;-- min lon
res@mpRightCornerLonF = mmaxlon ;-- max lon
else
res@mpLeftCornerLatF = DEU_minlat ;-- min lat
res@mpRightCornerLatF = DEU_maxlat ;-- max lat
res@mpLeftCornerLonF = DEU_minlon ;-- min lon
res@mpRightCornerLonF = DEU_maxlon ;-- max lon
end if
res@mpDefaultFillColor = 16 ;-- draw land in gray
res@mpOutlineOn = True ;-- draw map outlines
res@mpDataBaseVersion = "HighRes" ;-- use HighRes map
res@mpDataResolution = "Fine" ;-- we need a finer resolution
res@tiMainFontHeightF = 0.018 ;-- title font size
res@pmTickMarkDisplayMode = "Always" ;-- better tickmark labels
res@vpHeightF = 0.72
res@vpWidthF = 1.0
res@vpXF = 0.01
res@vpYF = 0.84
res@tmYLLabelFontHeightF = 0.013
res@tmXBLabelFontHeightF = 0.013
res@tmXBMajorLengthF = 0.01
res@tmYLMajorLengthF = 0.01
res@tiMainString = " "
res@cnFillOn = True ;-- contour fill on
res@cnLinesOn = False ;-- turn off contour lines
res@cnLineLabelsOn = False ;-- turn off contour line labels
res@cnLevelSelectionMode = "ManualLevels" ;-- set levels
res@cnMinLevelValF = min(var) ;-- min values
res@cnMaxLevelValF = max(var) ;-- max values
res@cnLevelSpacingF = 0.5 ;-- increment value
res@cnFillPalette = "rainbow" ;-- colormap
res@cnMissingValFillColor = -1 ;-- set missing fill color to 100% transparency
res@lbLabelBarOn = False
plot_orig = gsn_csm_contour_map(wks,var,res) ;-- create contour plot to retrieve the
;-- levels and colors values, but don't draw it
;-- this gives us the colors and levels to use for the filled polygons
getvalues plot_orig@contour
"cnLevels" : levels ;-- retrieve levels
"cnFillColors" : colors ;-- retrieve colors
"cnInfoLabelFontHeightF" : font_h ;-- retrieve font height
end getvalues
map = setColorContourClear(plot_orig,min(var),max(var))
;-----------------------------------
;-- 1. State - Schleswig-Holstein
;-----------------------------------
wc1 = new(dimsizes(county_names),typeof(county_names)) ;-- assign array for the selected counties
if(.not.isatt(wc1,"_FillValue")) then
wc1@_FillValue = default_fillvalue(typeof(county_names)) ;-- make sure "wc" has a missing value
end if
n=0
do m=0,dimsizes(county_names)-1
if(states(m).eq.state_name(0)) then
wc1(n) = county_names(m) ;-- get counties of the state
else
wc1(n) = default_fillvalue(typeof(county_names)) ;-- set other counties to missing value
end if
n=n+1
end do
wcounties1 = ind(.not. ismissing(wc1)) ;-- indices of counties
;-- calculate the averages
var_avg1 = avg_by_county(wks, map, var, shpf3, state_name(0), wcounties1, levels, colors)
print("--------------------------------------------------")
print("Data values: " + num(.not. ismissing(var_avg1))+ " Missing values: " + num(ismissing(var_avg1)))
;-- get the correct color indices for the averaged data
col_avg1 = new(dimsizes(wc1),integer) ;-- assign new color map
do i=0,dimsizes(wc1)-1
if(ismissing(var_avg1(i))) then
col_avg1(i) = res@cnMissingValFillColor ;-- if missing value use cnMissingValFillColor
else
do j=0,dimsizes(levels)-1
if (var_avg1(i).lt.levels(0)) then
col_avg1(i) = colors(0) ;-- values less than min(levels)
else if(var_avg1(i).ge.levels(dimsizes(levels)-1)) then
col_avg1(i) = colors(dimsizes(colors)-1) ;-- values greater than max(levels)
else if(var_avg1(i).ge.levels(j).and.var_avg1(i).lt.levels(j+1)) then
col_avg1(i) = colors(j+1) ;-- values in between
end if
end if
end if
end do
end if
end do
print("--------------------------------------------------")
;-- draw only the colored data averages in the counties polygons of selected state
dum_poly1 = add_shapefile_polygons(wks, map, state_name(0), col_avg1, shpf3, True)
print("added polygons to the plot ... done")
;-- draw all county polylines on top
if(counties_border) then
dum_polyl1 = add_shapefile_polylines(wks, map, state_name(0), col_avg1, shpf3, True)
print("added polylines to the plot ... done")
end if
;-----------------------------------
;-- 2. State - Hamburg
;-----------------------------------
wc2 = new(dimsizes(county_names),typeof(county_names)) ;-- assign array for the selected counties
if(.not.isatt(wc2,"_FillValue")) then
wc2@_FillValue = default_fillvalue(typeof(county_names)) ;-- make sure "wc" has a missing value
end if
n=0
do m=0,dimsizes(county_names)-1
if(states(m).eq.state_name(1)) then
wc2(n) = county_names(m) ;-- get counties of the state
else
wc2(n) = default_fillvalue(typeof(county_names)) ;-- set other counties to missing value
end if
n=n+1
end do
wcounties2 = ind(.not. ismissing(wc2)) ;-- indices of counties
;-- calculate the averages
var_avg2 = avg_by_county(wks, map, var, shpf3, state_name(1), wcounties2, levels, colors)
print("--------------------------------------------------")
print("Data values: " + num(.not. ismissing(var_avg2))+ " Missing values: " + num(ismissing(var_avg2)))
;-- get the correct color indices for the averaged data
col_avg2 = new(dimsizes(wc2),integer) ;-- assign new color map
do i=0,dimsizes(wc2)-1
if(ismissing(var_avg2(i))) then
col_avg2(i) = res@cnMissingValFillColor ;-- if missing value use cnMissingValFillColor
else
do j=0,dimsizes(levels)-1
if (var_avg2(i).lt.levels(0)) then
col_avg2(i) = colors(0) ;-- values less than min(levels)
else if(var_avg2(i).ge.levels(dimsizes(levels)-1)) then
col_avg2(i) = colors(dimsizes(colors)-1) ;-- values greater than max(levels)
else if(var_avg2(i).ge.levels(j).and.var_avg2(i).lt.levels(j+1)) then
col_avg2(i) = colors(j+1) ;-- values in between
end if
end if
end if
end do
end if
end do
print("--------------------------------------------------")
;-- draw only the colored data averages in the counties polygons of selected state
dum_poly2 = add_shapefile_polygons(wks, map, state_name(1), col_avg2, shpf3, True)
print("added polygons to the plot ... done")
;-- draw all county polylines on top
if(counties_border) then
dum_polyl2 = add_shapefile_polylines(wks, map, state_name(1), col_avg2, shpf3, True)
print("added polylines to the plot ... done")
end if
;-----------------------------------
;-- 3. State - Bremen
;-----------------------------------
wc3 = new(dimsizes(county_names),typeof(county_names)) ;-- assign array for the selected counties
if(.not.isatt(wc3,"_FillValue")) then
wc3@_FillValue = default_fillvalue(typeof(county_names)) ;-- make sure "wc" has a missing value
end if
n=0
do m=0,dimsizes(county_names)-1
if(states(m).eq.state_name(2)) then
wc3(n) = county_names(m) ;-- get counties of the state
else
wc3(n) = default_fillvalue(typeof(county_names)) ;-- set other counties to missing value
end if
n=n+1
end do
wcounties3 = ind(.not. ismissing(wc3)) ;-- indices of counties
;-- calculate the averages
var_avg3 = avg_by_county(wks, map, var, shpf3, state_name(2), wcounties3, levels, colors)
print("--------------------------------------------------")
print("Data values: " + num(.not. ismissing(var_avg3))+ " Missing values: " + num(ismissing(var_avg3)))
;-- get the correct color indices for the averaged data
col_avg3 = new(dimsizes(wc3),integer) ;-- assign new color map
do i=0,dimsizes(wc3)-1
if(ismissing(var_avg3(i))) then
col_avg3(i) = res@cnMissingValFillColor ;-- if missing value use cnMissingValFillColor
else
do j=0,dimsizes(levels)-1
if (var_avg3(i).lt.levels(0)) then
col_avg3(i) = colors(0) ;-- values less than min(levels)
else if(var_avg3(i).ge.levels(dimsizes(levels)-1)) then
col_avg3(i) = colors(dimsizes(colors)-1) ;-- values greater than max(levels)
else if(var_avg3(i).ge.levels(j).and.var_avg3(i).lt.levels(j+1)) then
col_avg3(i) = colors(j+1) ;-- values in between
end if
end if
end if
end do
end if
end do
print("--------------------------------------------------")
;-- draw only the colored data averages in the counties polygons of selected state
dum_poly3 = add_shapefile_polygons(wks, map, state_name(2), col_avg3, shpf3, True)
print("added polygons to the plot ... done")
;-- draw all county polylines on top
if(counties_border) then
dum_polyl3 = add_shapefile_polylines(wks, map, state_name(2), col_avg3, shpf3, True)
print("added polylines to the plot ... done")
end if
;-----------------------------------
;-- 4. State - Niedersachsen
;-----------------------------------
wc4 = new(dimsizes(county_names),typeof(county_names)) ;-- assign array for the selected counties
if(.not.isatt(wc4,"_FillValue")) then
wc4@_FillValue = default_fillvalue(typeof(county_names)) ;-- make sure "wc" has a missing value
end if
n=0
do m=0,dimsizes(county_names)-1
if(states(m).eq.state_name(3)) then
wc4(n) = county_names(m) ;-- get counties of the state
else
wc4(n) = default_fillvalue(typeof(county_names)) ;-- set other counties to missing value
end if
n=n+1
end do
wcounties4 = ind(.not. ismissing(wc4)) ;-- indices of counties
;-- calculate the averages
var_avg4 = avg_by_county(wks, map, var, shpf3, state_name(3), wcounties4, levels, colors)
print("--------------------------------------------------")
print("Data values: " + num(.not. ismissing(var_avg4))+ " Missing values: " + num(ismissing(var_avg4)))
;-- get the correct color indices for the averaged data
col_avg4 = new(dimsizes(wc4),integer) ;-- assign new color map
do i=0,dimsizes(wc4)-1
if(ismissing(var_avg4(i))) then
col_avg4(i) = res@cnMissingValFillColor ;-- if missing value use cnMissingValFillColor
else
do j=0,dimsizes(levels)-1
if (var_avg4(i).lt.levels(0)) then
col_avg4(i) = colors(0) ;-- values less than min(levels)
else if(var_avg4(i).ge.levels(dimsizes(levels)-1)) then
col_avg4(i) = colors(dimsizes(colors)-1) ;-- values greater than max(levels)
else if(var_avg4(i).ge.levels(j).and.var_avg4(i).lt.levels(j+1)) then
col_avg4(i) = colors(j+1) ;-- values in between
end if
end if
end if
end do
end if
end do
print("--------------------------------------------------")
;-- draw only the colored data averages in the counties polygons of selected state
dum_poly4 = add_shapefile_polygons(wks, map, state_name(3), col_avg4, shpf3, True)
print("added polygons to the plot ... done")
;-- draw all county polylines on top
if(counties_border) then
dum_polyl4 = add_shapefile_polylines(wks, map, state_name(3), col_avg4, shpf3, True)
print("added polylines to the plot ... done")
end if
;-----------------------------------
;-- 5. State - Mecklenburg-Vorpommern
;-----------------------------------
wc5 = new(dimsizes(county_names),typeof(county_names)) ;-- assign array for the selected counties
if(.not.isatt(wc5,"_FillValue")) then
wc5@_FillValue = default_fillvalue(typeof(county_names)) ;-- make sure "wc" has a missing value
end if
n=0
do m=0,dimsizes(county_names)-1
if(states(m).eq.state_name(4)) then
wc5(n) = county_names(m) ;-- get counties of the state
else
wc5(n) = default_fillvalue(typeof(county_names)) ;-- set other counties to missing value
end if
n=n+1
end do
wcounties5 = ind(.not. ismissing(wc5)) ;-- indices of counties
;-- calculate the averages
var_avg5 = avg_by_county(wks, map, var, shpf3, state_name(4), wcounties5, levels, colors)
print("--------------------------------------------------")
print("Data values: " + num(.not. ismissing(var_avg5))+ " Missing values: " + num(ismissing(var_avg5)))
;-- get the correct color indices for the averaged data
col_avg5 = new(dimsizes(wc5),integer) ;-- assign new color map
do i=0,dimsizes(wc5)-1
if(ismissing(var_avg5(i))) then
col_avg5(i) = res@cnMissingValFillColor ;-- if missing value use cnMissingValFillColor
else
do j=0,dimsizes(levels)-1
if (var_avg5(i).lt.levels(0)) then
col_avg5(i) = colors(0) ;-- values less than min(levels)
else if(var_avg5(i).ge.levels(dimsizes(levels)-1)) then
col_avg5(i) = colors(dimsizes(colors)-1) ;-- values greater than max(levels)
else if(var_avg5(i).ge.levels(j).and.var_avg5(i).lt.levels(j+1)) then
col_avg5(i) = colors(j+1) ;-- values in between
end if
end if
end if
end do
end if
end do
print("--------------------------------------------------")
;-- draw only the colored data averages in the counties polygons of selected state
dum_poly5 = add_shapefile_polygons(wks, map, state_name(4), col_avg5, shpf3, True)
print("added polygons to the plot ... done")
;-- draw all county polylines on top
if(counties_border) then
dum_polyl5 = add_shapefile_polylines(wks, map, state_name(4), col_avg5, shpf3, True)
print("added polylines to the plot ... done")
end if
;------------------------------------------
;-- draw the states borderlines of Germany
;------------------------------------------
if(states_border) then
shp_name1 = "DEU_adm1.shp" ;-- shapefile to be used
shp_fname1 = shapefile_dir+shp_name1 ;-- path of shapefile
sborder = gsn_add_shapefile_polylines(wks, map, shp_fname1, True)
print("added states polylines to the plot ... done")
end if
;------------------------------------------
;-- draw the borderline of Germany
;------------------------------------------
if(country_border) then
shp_name0 = "DEU_adm0.shp" ;-- shapefile to be used
shp_fname0 = shapefile_dir+shp_name0 ;-- path of shapefile
cborder = gsn_add_shapefile_polylines(wks, map, shp_fname0, True)
print("added country polylines to the plot ... done")
end if
;------------------------------------------
;-- add a common labelbar
;------------------------------------------
lbres = True
lbres@lbPerimOn = False ;-- don't draw labelbar boxes
lbres@lbOrientation = "Horizontal" ;-- labelbar orientation
lbres@vpWidthF = 0.7 ;-- width of the labelbar
lbres@vpHeightF = 0.08 ;-- height of the labelbar
lbres@lbLabelFontHeightF = 0.012 ;-- labelbar label font height
lbres@lbLabelAlignment = "InteriorEdges" ;-- labelbar label alignment
lbres@lbMonoFillPattern = True ;-- labelbar solid fill
lbres@lbFillColors = colors ;-- labelbar colors (must be RGB triplets)
labels = "" + levels ;-- set labels
nlevels = dimsizes(levels) ;-- number of levels
gsn_labelbar_ndc (wks,nlevels+1,labels,0.16,0.084,lbres) ;-- add labelbar
;------------------------------------------
;-- add title strings
;------------------------------------------
title0 = "Germany"
title1 = "data averaged over the counties"
title2 = "(grid: dlon="+sprintf("%5.3f",delta_x)+"~S~o~N~ dlat="+sprintf("%5.3f",delta_y)+"~S~o~N~)"
names = state_name
if(dimsizes(state_name).gt.1) then
names := " "+state_name(0)
do mm=1,dimsizes(state_name)-1
if(dimsizes(state_name).gt.3.and.mm.eq.3) then
names := names + ",~C~" + state_name(mm)
else
names := names + ", " + state_name(mm)
end if
end do
end if
tires = True ;-- text resources title string
tires@txFontHeightF = 0.024 ;-- text font size
res@txFontThicknessF = 1.8 ;-- bold
tires@txJust = "CenterCenter" ;-- text justification
gsn_text_ndc(wks,names,0.5, 0.950, tires) ;-- center upper title string
tires@txFontHeightF = 0.014 ;-- text font size
gsn_text_ndc(wks,title0, 0.5, 0.905, tires) ;-- center middle title string
gsn_text_ndc(wks,title1, 0.5, 0.885, tires) ;-- center middle title string
tires@txFontHeightF = 0.012 ;-- text font size
gsn_text_ndc(wks,title2, 0.5, 0.865, tires) ;-- center lower title string
;------------------------------------------
;-- add units to labelbar and the copyright string
;------------------------------------------
tires@txJust = "BottomRight" ;-- text justification
tires@txFontHeightF = 0.012 ;-- make font size smaller
gsn_text_ndc(wks,"Temperature [~S~o~N~C]", 0.6, 0.005, tires) ;-- plot units string
gsn_text_ndc(wks,"~F35~c ~F21~~N~DKRZ", 0.92, 0.005, tires) ;-- plot copyright info
;------------------------------------------
;-- create the plot and advance the frame
;------------------------------------------
draw(map)
frame(wks)
;------------------------------------------
end_date = toint(systemfunc("date +%s"))
print("Elapsed time: "+(end_date-start_date)+"s")
end
Result: