DKRZ NCL slice plot example#
DKRZ NCL example script:
;-----------------------------------------------------------------
; DKRZ NCL Example: NCL_slices.ncl
;
; 30.10.14 kmf
;-----------------------------------------------------------------
begin
;-- define file name
diri = "./"
fili = "rectilinear_grid_3D.nc"
;-- open file and read variable
f = addfile(diri+fili, "r")
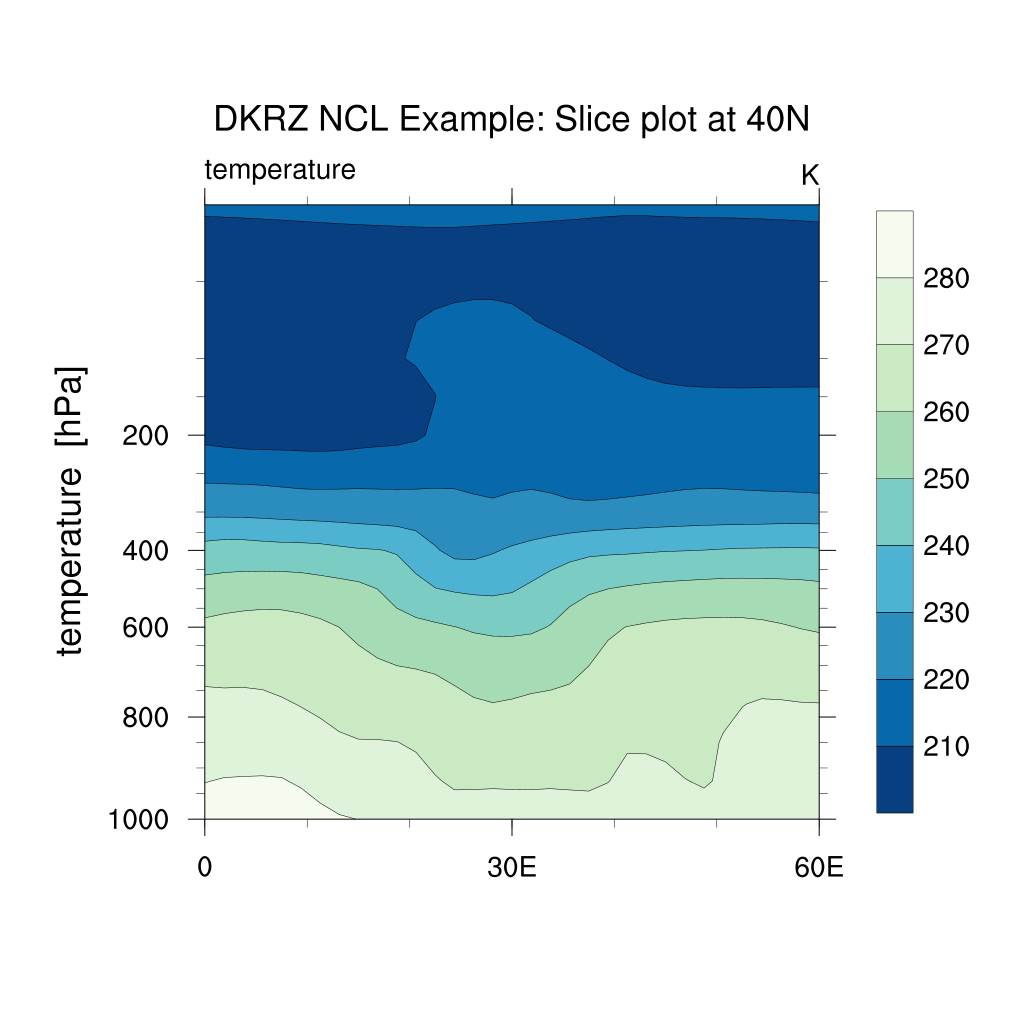
var = f->t(0,:,{40},{0:60}) ;-- first time step, latitude=40N, longitude=0-60E.
lon_t = f->lon({0:60}) ;-- longitude=0-60E
lev_t = f->lev ;-- currently 17 levels
;-- define workstation
wks = gsn_open_wks("png","plot_slices")
;-- set resources
res = True
res@tiMainString = "DKRZ NCL Example: Slice plot at 40N" ;-- title string
cmap = read_colormap_file("MPL_GnBu") ;-- read the color map
res@cnFillOn = True ;-- turn on color fill
res@cnFillPalette = cmap(::-1,:)
res@cnLineLabelsOn = False ;-- turns off contour line labels
res@cnInfoLabelOn = False ;-- turns off contour info label
res@lbOrientation = "vertical" ;-- vertical label bar
res@tiYAxisString = var@long_name+" [hPa]"
res@sfXArray = lon_t ;-- uses lon_t as plot x-axis
res@sfYArray = lev_t/100 ;-- uses lev_t in hPa as plot y-axis
res@trYReverse = True ;-- reverses y-axis
;-- generate the plot
plot = gsn_csm_contour(wks,var,res)
end
Result: