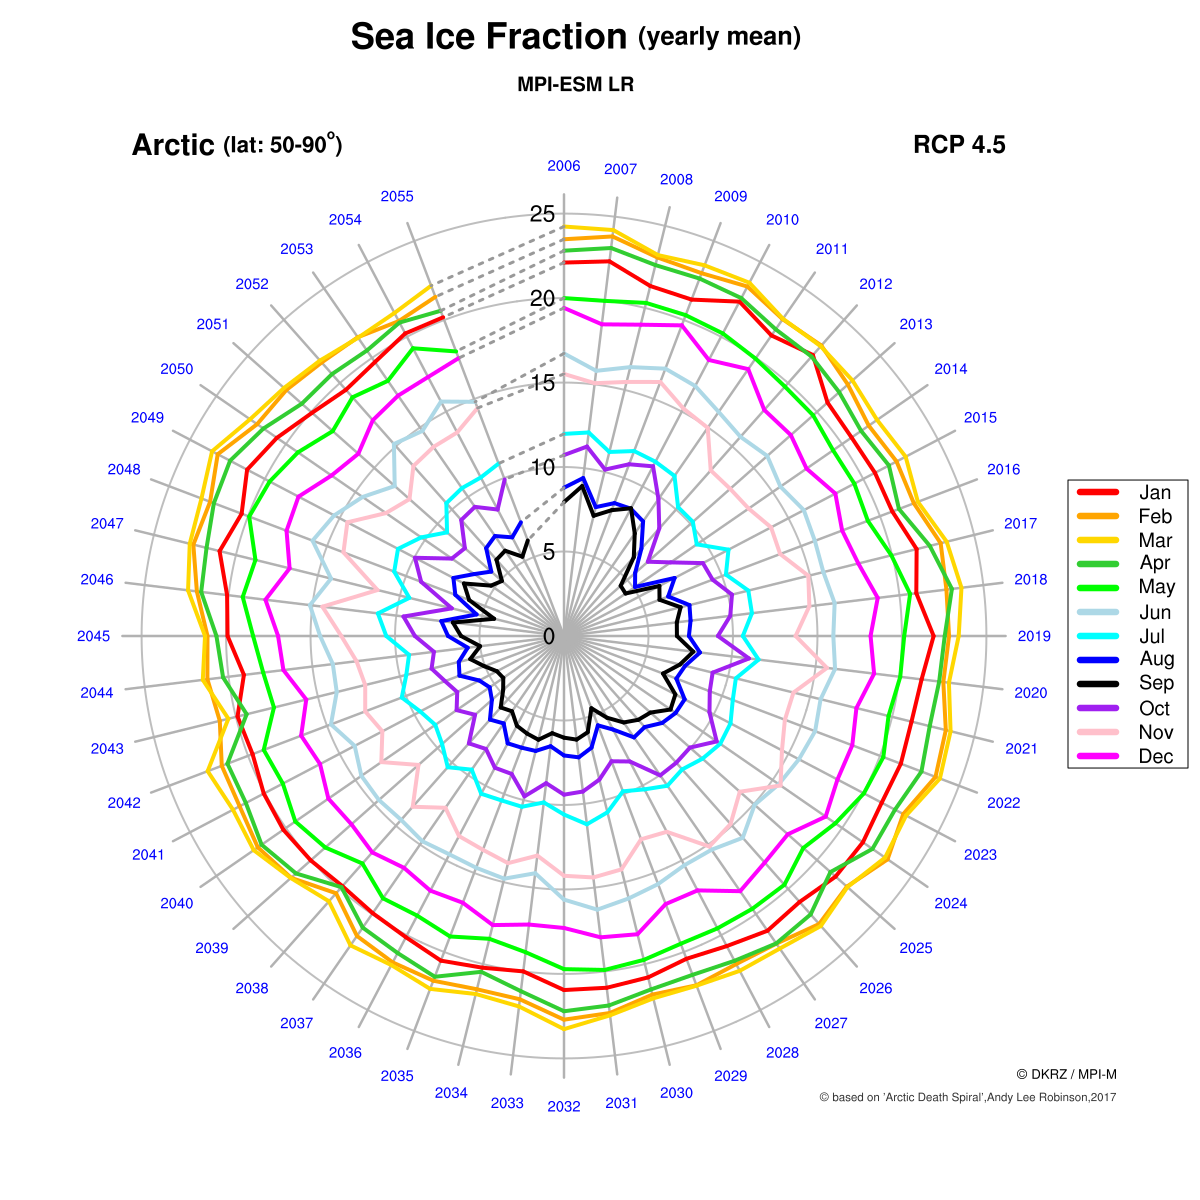
DKRZ NCL Spiral of sea ice fraction#
Example script:
;------------------------------------------------------------------------
;-- DKRZ NCL example: seaIce_spiral_connect_end_start.ncl
;--
;-- Description: Plot yearly seaIce fraction similar to the spiral
;--     plot 'Arctic Death Spiral' of Andy Lee Robinson
;--     (2017)
;--
;-- NCL Version: 6.4.0
;--
;-- DKRZ (German Climate Computing Center)
;-- Bundesstrasse 45a
;-- 20146 Hamburg
;-- Germany
;--
;-- 14.07.17 meier-fleischer(at)dkrz.de
;------------------------------------------------------------------------
;-- global variables
;------------------------------------------------------------------------
NUM_OF_YEARS = 50 ;-- how many years should be drawn
MIN_VALUE = 0 ;-- minimum value
MAX_VALUE = 25 ;-- maximum value (outer circle)
VALUE_INCREMENT = 5 ;-- distance value of circles

CONNECT = True ;-- True: connect last and first, False: don't connect

;------------------------------------------------------------------------
begin
 start_date = toint(systemfunc("date +%s")) ;-- computing start time

 diri = "$HOME/data/CMIP5/seaIce/"
 icefile1 = "sic_OImon_MPI-ESM-LR_rcp45_r1i1p1_200601-210012.nc"
 icefile2 = "sic_OImon_MPI-ESM-LR_rcp45_r1i1p1_210101-230012.nc"
 icefile = "sic_OImon_MPI-ESM-LR_rcp45_r1i1p1_200601-230012.nc"
 ymfile = "sic_OImon_MPI-ESM-LR_rcp45_r1i1p1_200612-230012_arctic_fldmean_"+NUM_OF_YEARS+"y.nc"

 varname = "sic"

 title = "Sea Ice Fraction ~Z70~(yearly mean)"
 title2 = "~Z55~MPI-ESM LR" ;-- title string, top
 subtitle = "Arctic ~Z75~(lat: 50-90~S~o~N~)" ;-- sub-title string, bottom center
 rcptext = "RCP 4.5" ;-- rcp string, upper left

;-- merge all data files
 if(.not. fileexists(diri+icefile)) then
    system("cdo -r -mergetime "+diri+icefile1+" "+diri+icefile2+" "+diri+icefile)
 else
    print("--> sic data file 200612-230012 already exist")
 end if

;-- select 40 years arctic region (lat: 50-90)
 if(.not. fileexists(diri+ymfile)) then
    NUM_OF_MONTHS = NUM_OF_YEARS*12
    system("cdo -r --reduce_dim -fldmean -sellonlatbox,-180.0,180.0,50.0,90.0 -seltimestep,1/"+NUM_OF_MONTHS+" "+diri+icefile+" "+diri+ymfile)
 else
    print("--> sic "+NUM_OF_YEARS+" years field mean arctic already exist")
 end if

;------------------------------------------------------------------------
;-- open the data file and read variable time
;------------------------------------------------------------------------
 f = addfile(diri+ymfile,"r")
 sic = f->sic
 time = f->time
 ntimes = dimsizes(time)

;------------------------------------------------------------------------
;-- select the data of each month
;------------------------------------------------------------------------
 sic_jan = sic( 0:ntimes-1:12)
 sic_feb = sic( 1:ntimes-1:12)
 sic_mar = sic( 2:ntimes-1:12)
 sic_apr = sic( 3:ntimes-1:12)
 sic_may = sic( 4:ntimes-1:12)
 sic_jun = sic( 5:ntimes-1:12)
 sic_jul = sic( 6:ntimes-1:12)
 sic_aug = sic( 7:ntimes-1:12)
 sic_sep = sic( 8:ntimes-1:12)
 sic_oct = sic( 9:ntimes-1:12)
 sic_nov = sic(10:ntimes-1:12)
 sic_dec = sic(11:ntimes-1:12)

 sic_all = (/sic_jan,sic_feb,sic_mar,sic_apr,sic_may,sic_jun,sic_jul,sic_aug,sic_sep,sic_oct,sic_nov,sic_dec/)

;-- minimum/maximum/increment of data
 valMin = MIN_VALUE
 valMax = MAX_VALUE
 valInt = VALUE_INCREMENT
 circleinc = valInt ;-- circle increment
 ncircles = valMax/circleinc ;-- number of circles

;-- define 12 colors
 colors = (/"red", "orange", "gold", "limegreen", "green","lightblue", \
            "cyan","blue","black","purple","pink","magenta"/)
 ncols = dimsizes(colors)

;-- read years
 utc_date = cd_calendar(time, 0) ;-- convert date to UT-referenced date
 years = sprinti("%0.4i",tointeger(utc_date(:,0)));-- get year as integer value
 years := years(::12) ;-- get years only once
 nyears = dimsizes(years)
 print("")
 print("--> Number of years: "+nyears)
 print("--> Number of colors: "+ncols)
 print("")

;------------------------------------------------------------------------
;-- graphics
;------------------------------------------------------------------------
;-- set workstation resources

 window_width = 1200
 window_height = 1200
 if(window_width .eq. 1200) then
    line_width = 8
 else
    line_width =  3
 end if
 end if

 wks_type = "png" ;-- plot output type
 wks_type@wkWidth = window_width ;-- for presentations
 wks_type@wkHeight = window_height ;-- for presentations
 wks = gsn_open_wks(wks_type,"plot_seaIce_arctic_spiral_connect")

;-- define viewport values for blank plot
 xf = 0.01 ;-- viewport x position
 yf = 0.95 ;-- viewport y position
 wf = 0.88 ;-- viewport width
 hf = 0.88 ;-- viewport height
 scale = wf/2

;------------------------------------------------------------------------
;-- set resources for the blank plot
;------------------------------------------------------------------------
 res = True ;-- set resources for plot
 res@gsnDraw = False ;-- don't draw plot yet
 res@gsnFrame = False ;-- don't advance frame

 res@tiMainFontHeightF = 0.02 ;-- main title font size
 res@tiMainOffsetYF = 0.06 ;-- move title upward
 res@tiMainFontColor = "white" ;-- set font color to white

 res@vpWidthF = 0.8 ;-- set viewport width
 res@vpHeightF = 0.8 ;-- set viewport height
 res@vpXF = 0.07 ;-- set viewport Y position
 res@vpYF = 0.87 ;-- set viewport Y position

 res@trXMinF = 0. ;-- x-axis minimum
 res@trXMaxF = 1. ;-- x-axis maximum
 res@trYMinF = 0. ;-- y-axis minimum
 res@trYMaxF = 1. ;-- y-axis maximum

 res@tmXBBorderOn = False ;-- no x-axis bottom line
 res@tmXBOn = False ;-- don't draw bottom x-axis
 res@tmXTBorderOn = False
 res@tmXTOn = False ;-- don't draw top x-axis
 res@tmYLBorderOn = False
 res@tmYLOn = False ;-- don't draw left y-axis
 res@tmYRBorderOn = False
 res@tmYROn = False ;-- don't draw right y-axis

;-- create blank base plots
 plot = gsn_csm_blank_plot(wks,res)

;-----------------------------------------------------------------------------------
;-- draw the circles and labels
;-----------------------------------------------------------------------------------
;-- set resources for circles
 lnres = True
 lnres@gsLineColor = "gray"
 lnres@gsLineThicknessF = 4.0

;-- text resources for value annotation of circles
 txvals = True
 txvals@txFontColor = "black"
 txvals@txFontHeightF = 0.014 ;-- make font size smaller
 txvals@txJust = "CenterRight" ;-- text justification
 txvals@txFont = 21 ;-- text font "courier-bold"

;-- degrees in radians (pi/180)
 deg2rad = (4.0*atan(1.))/180. ;-- degrees to radians
 degrees = ispan(0,360,1) ;-- assign array 0-360 degrees
 xcos = cos(deg2rad * degrees) ;-- convert degrees to radians
 xsin = sin(deg2rad * degrees) ;-- convert to radians
 xcenter = 0.5
 ycenter = 0.5

;------------------------------------------------------------------------
;-- define the radii, circles and labels dynamical
;------------------------------------------------------------------------
 dr = scale/(ncircles) ;-- distance between the circles
 radius = True ;-- object contains the radii
 idpl = True ;-- object contains the polylines
 idtx = True ;-- object contains zero circle

 do icic=0,ncircles-1
    rname = "radius"+icic
    radius@$rname$ = dr * (icic+1) ;-- add radius to object

    xname = "xc"+icic
    radius@$xname$ = xcenter + (radius@$rname$ * xcos);-- add x-array to object

    yname = "yc"+icic
    radius@$yname$ = ycenter + (radius@$rname$ * xsin);-- add y-array to object

    cicid = unique_string("cicid") ;-- create unique ids for the circles
    idpl@$cicid$ = gsn_add_polyline(wks, plot,radius@$xname$,radius@$yname$,lnres) ;-- add gray circles to object

    labcic = unique_string("labcic") ;-- create unique labels of the circles
    idtx@$labcic$ = gsn_add_text(wks,plot,(toint(icic)+1)*circleinc,\
                                           xcenter-0.01+((radius@$rname$)*cos(deg2rad*90.)),\
                                           xcenter +((radius@$rname$)*sin(deg2rad*90.)),\
                                           txvals) ;-- add circles to object
    if(icic .eq. 0) then
       idtx@zerocirc = gsn_add_text(wks,plot,toint(icic),xcenter-0.01,xcenter,txvals) ;-- add zero circle to object
    end if

    outer_radius = radius@$rname$
 end do

;------------------------------------------------------------------------
;-- text resources: labelbar units, copyright and year string
;------------------------------------------------------------------------
 txtitle = True ;-- text resources title string
 txtitle@txFontHeightF = 0.022 ;-- text font size
 txtitle@txJust = "CenterCenter" ;-- text justification
 txtitle@txFont = 22 ;-- text font "courier-bold"

 txrcp = txtitle ;-- text resource RCP string
 txrcp@txFontHeightF = 0.015 ;-- text font size

 txsubt = txtitle ;-- text resources subtitle string
 txsubt@txFontHeightF = 0.018 ;-- text font size
 txsubt@txJust = "CenterLeft" ;-- text justification

 txsubt1 = txsubt ;-- text resources subtitle string
 txsubt1@txFontHeightF = 0.015 ;-- text font size

 txcopy = txtitle ;-- text resources copyright string
 txcopy@txFontHeightF = 0.008 ;-- make font size smaller
 txcopy@txJust = "CenterRight" ;-- text justification

 txyears = txtitle ;-- text resources years string
 txyears@txFont = 21 ;-- text font "courier-bold"
 txyears@txFontColor = "blue"

;-- resize the font size depending on number of years
 if(NUM_OF_YEARS .ge. 70) then
    txyears@txFontHeightF = 0.009
 else if(NUM_OF_YEARS .ge. 60) then
    txyears@txFontHeightF = 0.008
 else if(NUM_OF_YEARS .ge. 50) then
    txyears@txFontHeightF = 0.009
 else if(NUM_OF_YEARS .ge. 40) then
    txyears@txFontHeightF = 0.010
 else if(NUM_OF_YEARS .lt. 40) then
    txyears@txFontHeightF = 0.012
 else
    txyears@txFontHeightF = 0.012
 end if
 end if
 end if
 end if
 end if

;-- yearly labels around plot; xy-coordinates for the yearly labels on circle
 dtx = fspan(90.,-270.,nyears+3)

 xtx := xcenter + ((outer_radius+0.05) * cos(deg2rad*dtx)) ;-- x-array for years labels
 ytx := ycenter + ((outer_radius+0.05) * sin(deg2rad*dtx)) ;-- y-array for years labels

 xlx := xcenter + ((outer_radius+0.02) * cos(deg2rad*dtx)) ;-- x-array for the lines from center to outer circle
 ylx := xcenter + ((outer_radius+0.02) * sin(deg2rad*dtx)) ;-- y-array for the lines from center to outer circle

 do k=0,nyears-1
    if(NUM_OF_YEARS .ge. 70) then
       txyears@txAngleF = dtx(k) ;-- rotate the year string
    end if
    ystr = unique_string("nyears") ;-- create unique strings
    plot@$ystr$ = gsn_add_text(wks,plot,years(k),xtx(k),ytx(k),txyears) ;-- years string
 end do

;-- add lines from center to max radius to plot
 dres = True
 dres@gsLineColor = (/0.7,0.7,0.7,1.0/) ;-- polyline color
 dres@gsLineThicknessF = 5.0 ;-- plolyline thickness

 do k=0,nyears-1
    lstr = unique_string("nline") ;-- create unique strings
    plot@$lstr$ = gsn_add_polyline(wks,plot,(/xcenter,xlx(k)/),(/ycenter,ylx(k)/),dres) ;-- center title string
 end do

;-----------------------------------------------------------------------------------
;-- data polyline resource settings
;-----------------------------------------------------------------------------------
 vres = True
 vres@gsLineThicknessF = line_width ;-- plolyline thickness

;-- create all data polylines
 do j=0,11
    sic_month = sic_all(j,:)

    do i=0,nyears-2
       print("Plot: month "+j+" year: "+years(i))

       data0 = ((sic_month(i) * scale) / MAX_VALUE)
       xd0 = xcenter + (data0 * cos(deg2rad*dtx(i)))
       yd0 = ycenter + (data0 * sin(deg2rad*dtx(i)))

       data1 = ((sic_month(i+1) * scale) / MAX_VALUE)
       xd1 = xcenter + (data1 * cos(deg2rad*dtx(i+1)))
       yd1 = ycenter + (data1 * sin(deg2rad*dtx(i+1)))

       vres@gsLineColor = colors(j) ;-- polyline color
       vstr = unique_string("vline") ;-- define unique string
       plot@$vstr$ = gsn_add_polyline(wks,plot,(/xd0,xd1/),(/yd0,yd1/),vres) ;-- draw data segment

 ;-- connect last year with first year
       if(i .eq. 0) then
          firstx0 = xd0
          firsty0 = yd0
       end if

       if(CONNECT .and. (i .eq. (nyears-2))) then
          lastx1 = xd1
          lasty1 = yd1
          vres1 = True
          vres1@gsLineColor = "gray60" ;-- polyline color
          vres1@gsLineThicknessF = line_width-2 ;-- plolyline thickness
          vres1@gsLineDashPattern = 2 ;-- line type
          vstr1 = unique_string("vline1") ;-- define unique string
          plot@$vstr1$ = gsn_add_polyline(wks,plot,(/firstx0,lastx1/),(/firsty0,lasty1/),vres1) ;-- draw data segment
       end if

    end do ;-- end loop over all years
 end do ;-- end loop over all months

;-----------------------------------------------------------------------------------
;-- add the annotations
;-----------------------------------------------------------------------------------
 lx = 0.02
 gsn_text_ndc(wks,title, 0.5-lx, 0.97, txtitle) ;-- top title string
 gsn_text_ndc(wks,title2, 0.5-lx, 0.93, txtitle) ;-- top title string
 gsn_text_ndc(wks,subtitle, 0.13-lx, 0.88, txsubt) ;-- subtitle
 gsn_text_ndc(wks,rcptext, 0.82-lx, 0.88, txrcp) ;-- plot RCP string

;-----------------------------------------------------------------------------------
;-- create legend from scratch
;-----------------------------------------------------------------------------------
 lineres = True
 lineres@gsLineThicknessF = line_width+5 ;-- line thickness

 labelres = True
 labelres@txFontHeightF = 0.012 ;-- label font height
 labelres@txJust = "CenterLeft" ;-- label font justification

 lgx = 0.90
 lgy = 0.59
 lgdx = 0.03
 lgdy = 0.02

 monlabels = (/"Jan","Feb","Mar","Apr","May","Jun","Jul","Aug","Sep","Oct","Nov","Dec"/)

 do ii=0,11
    lineres@gsLineColor = colors(ii)
    gsn_polyline_ndc(wks, (/lgx,lgx+lgdx/), (/lgy-(lgdy*ii),lgy-(lgdy*ii)/), lineres)
    gsn_text_ndc(wks, monlabels(ii), lgx+lgdx+0.02, lgy-(lgdy*ii), labelres)
 end do

 lgy_down = lgy-(lgdy*11)-0.01
 xn = 0.09
 yn = 0.1
 lgbox_x = (/lgx-0.01, lgx+xn, lgx+xn, lgx-0.01,lgx-0.01/)
 lgbox_y = (/lgy+0.01, lgy+0.01, lgy_down, lgy_down,lgy+0.01/)

 lineres@gsLineThicknessF = 2 ;-- line thickness
 lineres@gsLineColor = "black" ;-- line color

 gsn_polyline_ndc(wks, lgbox_x, lgbox_y, lineres)

;-----------------------------------------------------------------------------------
;-- add copyright texts
;-----------------------------------------------------------------------------------
 copyright = "~F35~c ~F21~~N~DKRZ / MPI-M"
 gsn_text_ndc(wks, copyright, 0.93, 0.105, txcopy) ;-- plot copyright info

 txcopy@txFontHeightF = 0.007 ;-- make font size smaller
 txcopy@txFontColor = "gray20" ;-- font color

 original = "~F35~c ~F21~~N~based on 'Arctic Death Spiral',Andy Lee Robinson,2017"
 gsn_text_ndc(wks, original, 0.93, 0.085, txcopy) ;-- plot copyright info

;-----------------------------------------------------------------------------------
;-- draw the plot and advance the frame
;-----------------------------------------------------------------------------------
 draw(plot)
 frame(wks)

;------------------------------------------------------------------------
;-- print some computing time information
;------------------------------------------------------------------------
 end_date = toint(systemfunc("date +%s")) ;-- computing used time
 print("")
 print("Start Time: "+start_date)
 print("End Time: "+end_date)
 print("Time for "+(j)+" time steps: "+(end_date-start_date)+"s")
 print("")

end
Result: