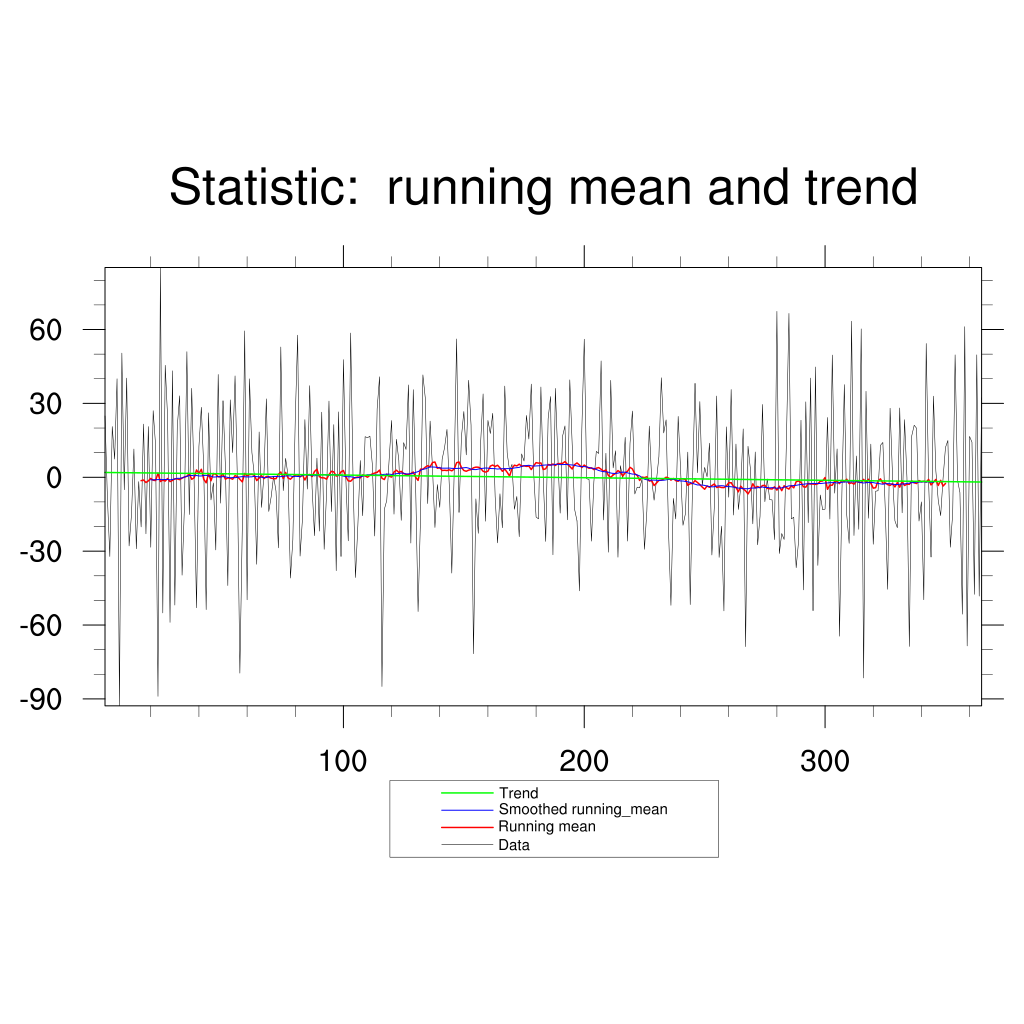
DKRZ NCL statistic running mean example#
DKRZ NCL script:
;-------------------------------------------------------------------
;-- NCL Doc Example: NCL_stat_running_mean_trend.ncl
;--
;-- Description:     Plot the data and the statistical running mean
;--                  and its trend.
;-- 19.05.14  kmf
;-------------------------------------------------------------------
;----------------------------------------------------------------------
;-- Function:  calc_stat_trend(...)
;--                ->  calculate the trend
;----------------------------------------------------------------------
undef("calc_stat_trend")
function calc_stat_trend(x,var)
local DEBUG,npts,a,b,c,tsum,tysum,tyval,tsqsum,tsqval,summe,val,ytquer,ttquer
begin
  DEBUG  = True
  npts   = dimsizes(x)
  c      = var
  tsum   = 0.
  tysum  = 0.
  tyval  = 0.
  tsqsum = 0.
  tsqval = 0.
  summe  = 0.
  val    = 0.

  do i=0,npts-1
     val    = var(i)
     summe  = summe+val
     tsum   = i+tsum
     tyval  = i*val
     tysum  = tyval+tysum
     tsqval = i*i
     tsqsum = tsqval+tsqsum
  end do

  ytquer = summe/(npts-1)
  ttquer = tsum/(npts-1)

  b = (tysum-(npts*ttquer*ytquer))/(tsqsum-(npts*ttquer*ttquer))
  a = (ytquer)-(b*(ttquer))

  if (DEBUG) then
     print("")
     print("+++++ trend: t2     =                   "+ npts)
     print("+++++ trend: summe  = sum of values   = "+ summe)
     print("+++++ trend: ytquer = summe/t2        = "+ ytquer)
     print("+++++ trend: tsum   = sum of t        = "+ tsum)
     print("+++++ trend: tquer  = tsum/t2         = "+ tsum/npts)
     print("+++++ trend: tysum  = sum of t*values = "+ tysum)
     print("+++++ trend: tsqsum = sum of t*t      = "+ tsqsum)
     print("")
     print("+++++ trend: linear regression equation:    y = "+a+" + "+b+" * t")
     print("")
  end if

  do i = 0,npts-1
     c(i)=a+(b*i)
  end do

  return(c)
end

;-------------------------------------------------------
;-- MAIN
;-------------------------------------------------------
begin
  x = ispan(1,365,1)
  y = (/24.9264,-8.361866, -32.16906, 20.60294, 7.384959, 40.00099, \
       -92.79871, 50.42744, -5.070408, 40.27705, -27.88171, -15.03915, \
       11.47537, -29.03874, -1.756587, -20.16744, 21.60254, -22.96009, \
       20.59936, -28.42203, 27.0571, 12.97648, -88.9543, 85.17473, \
       -55.08803, 45.47628, 24.15122, -58.92344, 43.25131, -51.89326, \
       20.54425, 33.07741, -39.74909, -11.37656, 51.00746, -15.13431, \
       36.12533, -1.521067, -52.99825,12.57256, 28.42521, 3.828768, \
       -53.74265, 26.17332, -9.199653, -2.309943, -29.50837, 41.74754, \
       -10.51091, 31.03505, 4.09079, -43.97025, 31.43508, 10.02173, \
       41.16813, -2.80632, -79.53146, -20.74533, 59.44746, -49.75961, \
       39.98883, 10.05335, 0.8409821, -35.33345, 18.40772, -12.2347, \
       1.105038, 31.84602, -13.8735, -7.891514, 0.3682705, -5.585191, \
       -28.66333, 52.90786, -5.409936, 7.680257, 0.7249982, -40.92494, \
       -25.33436, 23.74692, 57.71513, -32.00339, -16.75868, 23.42031, \
       -4.792629, 37.20881, -4.456624, -23.72248, 7.767448, -21.8565, \
       26.44745, -29.24916, -6.314954, 30.94873, -13.91431, 21.38537, \
       -37.93886, 26.56374, -32.10296, 47.78776, -0.4801184, -25.8139, \
       58.57794, -0.7972997, -40.70943, -19.4354, 6.80695, -15.61182, \
       16.48778, 16.05497, 16.69331, 5.19874, -23.85107, 27.78862, \
       40.81667, -84.96756, -12.97966, -9.382995, 7.511517, 23.06323, \
       -14.97894, 15.4442, 6.898167, -17.49207, 14.06445, 11.29572, \
       37.50677, -26.72132, 35.59035, -4.198732, -54.52291, -16.66267, \
       41.58054, 32.10245, -10.67811, 22.81898, 3.371699, -20.39278, \
       -2.959632, -12.20442, 7.349309, 12.05357, 19.43616, -4.506427, \
       -38.90607, 2.41556, 56.17836,-14.21334, 16.37525, 26.71167, \
       9.09359, 39.39703, 21.15053, -71.65178, -8.757985, -22.7589, \
       14.46975, 33.85746, -17.84287, 23.09438, 17.78081, 25.97645, \
       -7.781834, -26.64459, -6.69821, -20.50336, 37.03909, 9.835811, \
       2.60719, 5.255515, -12.98845, -7.794468, -24.1282, 9.487386, \
       6.582564, 25.11583, 15.52696, 37.84516, 1.754072, -16.12908, \
       -16.88242, 36.66131, -1.120736, -26.04581, 23.76035, 32.78828, \
       -31.48173, 36.0989, 9.240784, -14.55615, 16.70981, 20.86206, \
       -17.27525, 39.56828, 13.07125, -12.99599, -17.7401, -46.12418, \
       19.58386, 56.07545, -0.5685795, -0.9008529, -25.9442, -1.752784, \
       10.51259, 9.666623, 47.25177, -17.35054, 9.756303, -30.42878, \
       39.36865, 3.802191, 10.75947, -32.46304, 4.70647, -0.3541092, \
       16.2095, -25.91894, 13.74797, 26.89765, -6.783369, -3.999881, \
       -4.279597, -0.8352942, -29.25169, -13.72089, 20.788, -0.8843041, \
       -9.306261, -1.17004, 8.377829, 40.41809, 18.00184, 23.30745, \
       -21.75604, -51.99948, -8.58614, -16.91891, 24.7299, 3.172685, \
       -19.49131, -14.85031, 10.22103, -51.69467, -0.7927365, 38.09153, \
       1.860253, 30.74613, -3.257262, 4.002953, 0.2218886, 13.85386, \
       -31.56291, -12.19289, 32.99896, -32.52431, -19.88405, -54.25632, \
       20.47882, -8.080286, 35.64525, -15.34531, 13.49685, -13.06714, \
       -3.831783, 19.64373, -68.76797, 12.5983, 3.35871, -18.91072, \
       10.27991, -27.42312, -15.79099, 29.58066, -9.914533, -0.6830215, \
       -9.077754, -9.185384, -25.31908, 67.3791, -30.95538, -22.8384, \
       -25.2431, 17.0081, 66.54207, -16.88133, -16.24662, -36.7114, \
       -25.94501, 23.17612, -45.73708, 30.64136, -18.41788, 40.28629, \
       -54.11975, 44.79348, -35.77917, -7.19503, -13.19775, -12.92189, \
       24.29116, -16.98229, 49.63627, -6.452826, 11.50777, -64.53977, \
       -5.951408, 37.638, -15.28019, -26.81924, 63.38461, -23.64748, \
       8.656753, -21.12774, 60.26141, -81.49531, 34.91807, -16.63806, \
       13.47313, -27.20161, -5.661833, -5.45722, 12.96912, 14.15574, \
       -13.23332, -45.49319, 28.04377, 0.7724994, -17.6555, -20.47201, \
       28.1443, -14.44097, 23.40522, -0.1788197, -68.70046, 16.8583, \
       21.12821, 19.91207, -17.77668, -9.989548, -49.73676, 54.32707, \
       -2.146452, -32.35265, 32.95036, 2.574606, -9.437281, -15.56939, \
       -0.3845669, 12.12393, 14.93732, -28.40279, -14.69085, 49.71231, \
       -1.143925, -6.234774, -55.59104, 61.16213, -68.4799, 16.58861, \
       14.23054, -47.54554, 49.72101, -48.24809, 32.33456/)

  y_rave  = runave_n_Wrap(y,31,0,0)                      ;-- running mean
  y_rave2 = runave_n_Wrap(y_rave,10,0,0)                 ;-- smoothed running mean
  y_trend = calc_stat_trend(x,y)

  colors  = (/"black","red","blue","green"/)             ;-- set line colors
  labels  = (/"Data","Running mean","Smoothed running_mean","Trend"/) ;- legend labels
  pattern = (/0,  0,  0,  0/)                            ;-- line pattern
  size    = (/1.0,3.0,2.0,3.0/)                          ;-- line thickness

  data    = (/y,y_rave,y_rave2,y_trend/)                 ;-- data array to be plotted

;-- open workstation
  wks = gsn_open_wks ("png","plot_stat_running_mean_trend") ;-- open a workstation

;-- set resources
  res                      =  True
  res@gsnMaximize          =  True                       ;-- maximize plot output

  res@tiMainString         = "Statistic:  running mean and trend"  ;-- title

  res@vpHeightF            =  0.4                        ;-- viewport height
  res@vpWidthF             =  0.8                        ;-- viewport width
  res@vpXF                 =  0.125                      ;-- start x point

  res@trXMinF              =  min(x)                     ;-- x-axis minimum
  res@trXMaxF              =  max(x)                     ;-- x-axis maximum
  res@trYMinF              =  min(y)                     ;-- y-axis minimum
  res@trYMaxF              =  max(y)                     ;-- y-axis maximum

  res@lgJustification      = "TopRight"                  ;-- legend justification
  res@lgLabelFontHeightF   =  0.01                       ;-- legend label font size
  res@lgBoxMinorExtentF    =  0.16                       ;-- legend lines shorter

  res@pmLegendDisplayMode  = "Always"                    ;-- draw always the legend
  res@pmLegendWidthF       =  0.3                        ;-- set legend width
  res@pmLegendHeightF      =  0.07                       ;-- set legend height
  res@pmLegendParallelPosF =  0.7                        ;-- move legend right

  res@xyLineColors         =  colors                     ;-- set line colors
  res@xyExplicitLabels     =  labels                     ;-- set line labels
  res@xyMarkLineModes      = "Lines"                     ;-- line modus
  res@xyDashPatterns       =  pattern                    ;-- set line pattern
  res@xyLineThicknesses    =  size                       ;-- set line thickness

;-- draw the plot
  plot = gsn_csm_xy(wks, x, data, res)

end
Result:
