DKRZ NCL tick mark example#
Example script:
;--------------------------------------------------------------------
; DKRZ NCL Example: set_axis_labels.ncl
;
; Description: show how to change the x-axis labels
;
; 06.07.18 kmf
;--------------------------------------------------------------------
;-- generate x- and y-values
x = ispan(1,100,1)
y = random_uniform(0.0,24.0,100)
;-- open workstation
wks_type = "png"
wks_type@wkWidth = 1200
wks_type@wkHeight = 1200
wks = gsn_open_wks(wks_type,"plot_set_axis_labels")
;-- set resources
res0 = True
res0@gsnDraw = False ;-- draw the plots in memory
res0@gsnFrame = False ;-- don't advance the frame
res0@vpWidthF = 0.75 ;-- viewport width of plot
res0@vpHeightF = 0.4 ;-- viewport height of plot
res0@tiMainFontHeightF = 0.014 ;-- use smaller title font
res1 = res0 ;-- copy resources
res2 = res0 ;-- copy resources
;-- assign plot array
nplots = 3 ;-- number of plots
plots = new(nplots,graphic) ;-- plot array
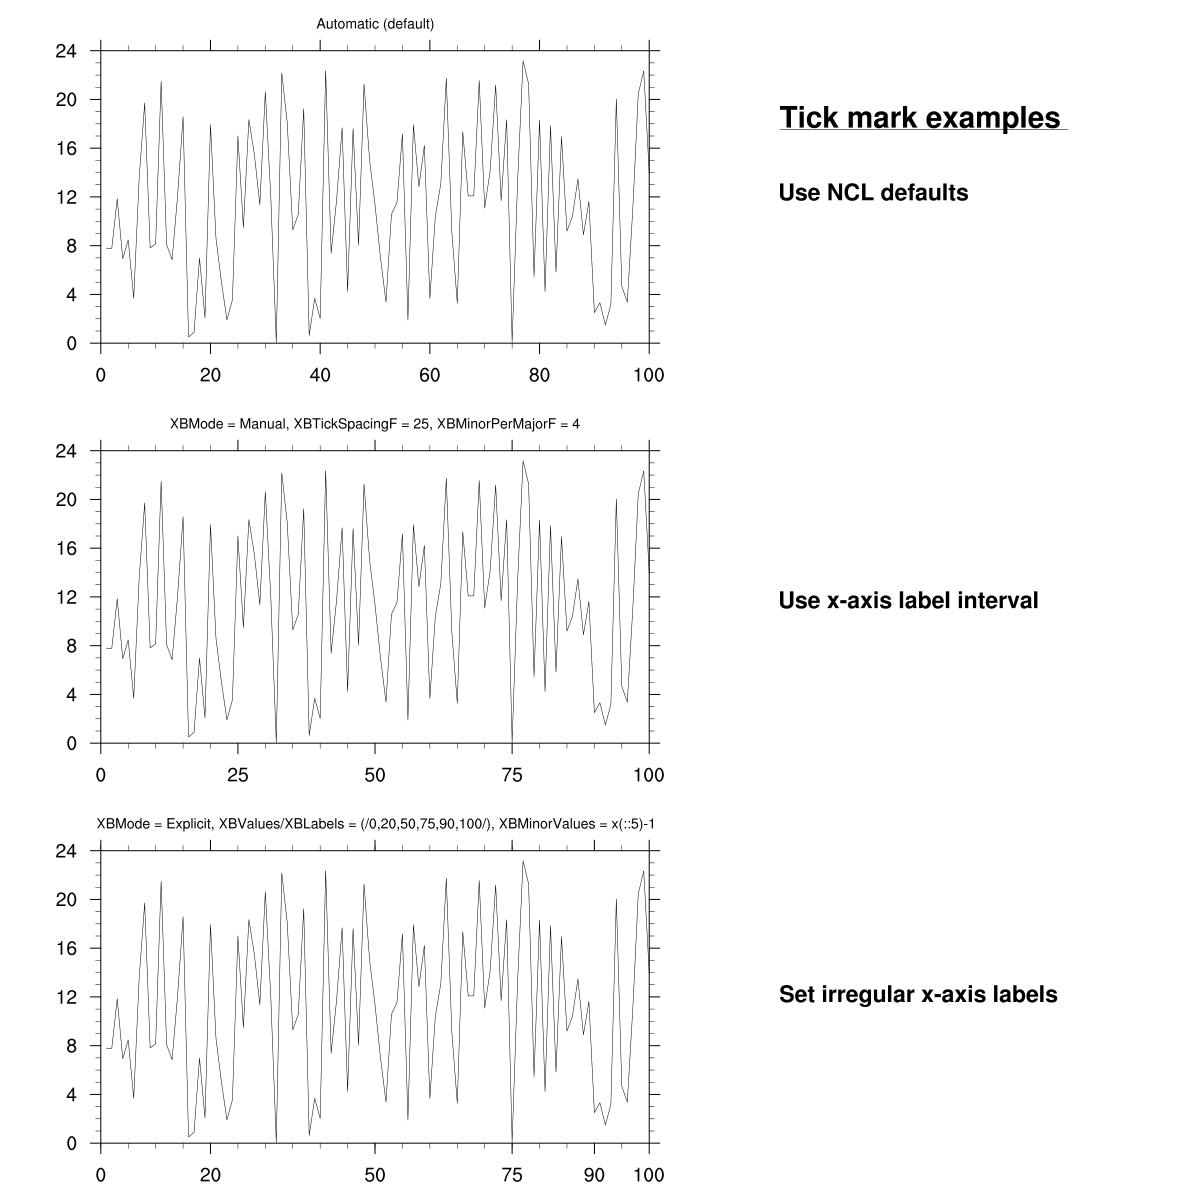
;-- plot 0 - let NCL do the job
res0@tiMainString = "Automatic (default)" ;-- title string
plots(0) = gsn_csm_xy(wks,x,y,res0) ;-- create the upper plot
;-- plot 1 - regular x-axis labels
res1@tmXBMode = "Manual" ;-- don't use default settings for tick marks
res1@tmXBTickSpacingF = 25 ;-- x major tick mark spacing
res1@tmXBMinorPerMajor = 4 ;-- set number of minor tick marks
res1@tiMainString = "XBMode = Manual, XBTickSpacingF = 25, XBMinorPerMajorF = 4"
plots(1) = gsn_csm_xy(wks,x,y,res1) ;-- create the middle plot
;-- plot 2 - irregular x-axis labels
xx = (/0,20,50,75,90,100/) ;-- values for x-axis
xlabels2 = ""+xx ;-- x-axis labels 0,20,50,75,90,100
res2@trXMinF = min(x)-1 ;-- x-axis minimum
res2@trXMaxF = max(x) ;-- x-axis maximum
res2@tmXBMode = "Explicit" ;-- use explicit x-axis bottom values
res2@tmXBValues = xx ;-- x-axis bottom values
res2@tmXBMinorValues = x(::5)-1 ;-- minor tick marks
res2@tmXBLabels = xlabels2 ;-- x-axis bottom labels
res2@tiMainString = "XBMode = Explicit, XBValues/XBLabels = (/0,20,50,75,90,100/), XBMinorValues = x(::5)-1"
plots(2) = gsn_csm_xy(wks,x,y,res2) ;-- create the lower plot
;-- create the panel
pres = True
pres@gsnFrame = False ;-- don't advance the frame
pres@gsnPanelRight = 0.6 ;-- move the panel to the right
pres@gsnPanelYWhiteSpacePercent = 5 ;-- some space between the plots
gsn_panel(wks,plots,(/nplots,1/),pres) ;-- draw the panel
;-- add the text to the right side of the plots
txres = True
txres@txFontHeightF = 0.018
txres@txJust = "CenterLeft"
txres@txFont = 22
gsn_text_ndc(wks,"Tick mark examples",0.65,0.9,txres)
gsn_polyline_ndc(wks,(/0.65,0.89/),(/0.892,0.892/),True)
txres@txFontHeightF = 0.014
gsn_text_ndc(wks,"Use NCL defaults", 0.65, 0.84, txres)
gsn_text_ndc(wks,"Use x-axis label interval", 0.65, 0.5, txres)
gsn_text_ndc(wks,"Set irregular x-axis labels", 0.65, 0.17, txres)
;-- advance the frame
frame(wks)
Result: