DKRZ NCL tickmarks example#
Example script:
;----------------------------------------------------------------------
;-- DKRZ NCL example: NCL_tickmarks.ncl
;--
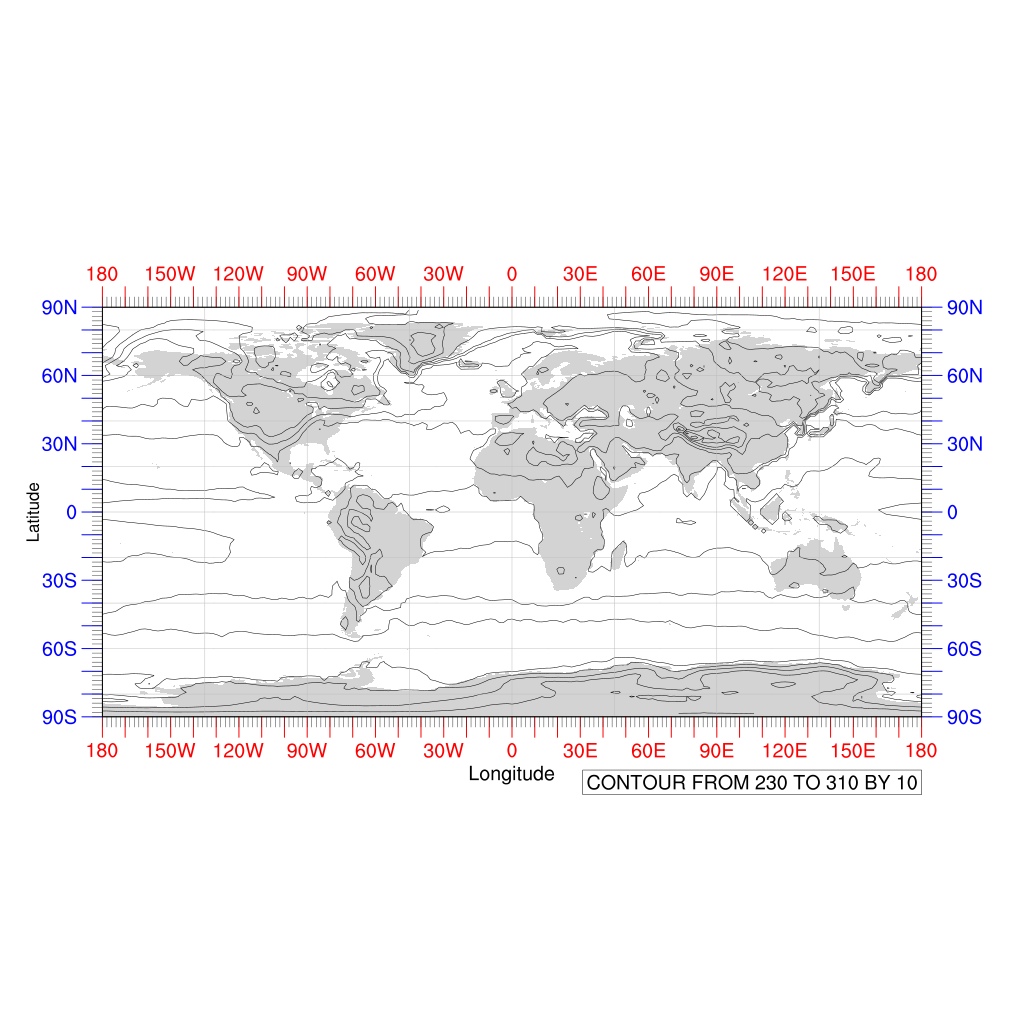
;-- Description: tickmarks settings
;-- - axis tickmarks
;-- - axis labels
;--
;-- 01.07.14 kmf
;----------------------------------------------------------------------
begin
;-- generate dummy data
x = ispan(0,100,1)
y = cos(0.0628*ispan(0,100,1)) ;-- generate a curve with 101 points.
;-- open a workstation with the resource settings above
wks_type = "png"
wks_type@wkWidth = 1024
wks_type@wkHeight = 1024
wks = gsn_open_wks(wks_type, "plot_tickmarks")
;-- map plot
f = addfile("$NCL_TUT/data/ECHAM5_OM_A1B_2001_0101-1001_2D.nc","r") ;-- open data file
var = f->tsurf(0,:,:) ;-- read variable
;-- resource settings
res = True
res@gsnLeftString = ""
res@gsnRightString = ""
res@cnLineLabelsOn = False
;-- latitude settings
res@gsnMajorLatSpacing = 10 ;-- change major lat tickmark spacing
res@gsnMinorLatSpacing = 2.5 ;-- change major lat tickmark spacing
res@tmYLLabelStride = 3 ;-- write only every 3rd label
res@tmYLLabelFontHeightF = 0.014 ;-- change major lat tickmark spacing
res@tmYLMajorLengthF = 0.02 ;-- change the tickmark length
res@tmYLMinorLengthF = 0.01 ;-- change the tickmark length
res@tmYLMajorLineColor = "blue" ;-- change major tickmarks color
res@tmYLMinorLineColor = "grey20" ;-- change major tickmarks color
res@tmYLLabelFontColor = "blue" ;-- change label color
res@tmYLLabelDeltaF = -0.6 ;-- increase distance between y-axis and labels
res@tmYRLabelsOn = True ;-- turn the YR labels on
res@tiYAxisString = "Latitude"
res@tiYAxisOffsetXF = -0.05
res@tiYAxisFontHeightF = 0.012
;-- longitude settings
res@gsnMajorLonSpacing = 10 ;-- change major lon tickmark spacing
res@gsnMinorLonSpacing = 2.5 ;-- change major lon tickmark spacing
res@tmXBLabelStride = 3 ;-- write only every 4th label
res@tmXBLabelFontHeightF = 0.014 ;-- change major lat tickmark spacing
res@tmXBMajorLengthF = 0.02 ;-- change the tickmark length
res@tmXBMinorLengthF = 0.01 ;-- change the tickmark length
res@tmXBMajorLineColor = "red" ;-- change major tickmarks color
res@tmXBMinorLineColor = "grey20" ;-- change major tickmarks color
res@tmXBLabelFontColor = "red" ;-- change label color
res@tmXBLabelDeltaF = -0.6 ;-- increase distance between x-axis and labels
res@tmXTLabelsOn = True ;-- turn the YR labels on
res@tiXAxisString = "Longitude"
res@tiXAxisOffsetYF = 0.04
res@tiXAxisFontHeightF = 0.014
;-- grid line settings
res@mpGridAndLimbOn = True ;-- draw grid lines on the plot
res@mpGridLatSpacingF = 20 ;-- grid line lat spacing
res@mpGridLonSpacingF = 45 ;-- grid line lon spacing
res@mpGridLineColor = "gray" ;-- grid line color
;-- create the plot
plot = gsn_csm_contour_map(wks,var,res)
end
Result: