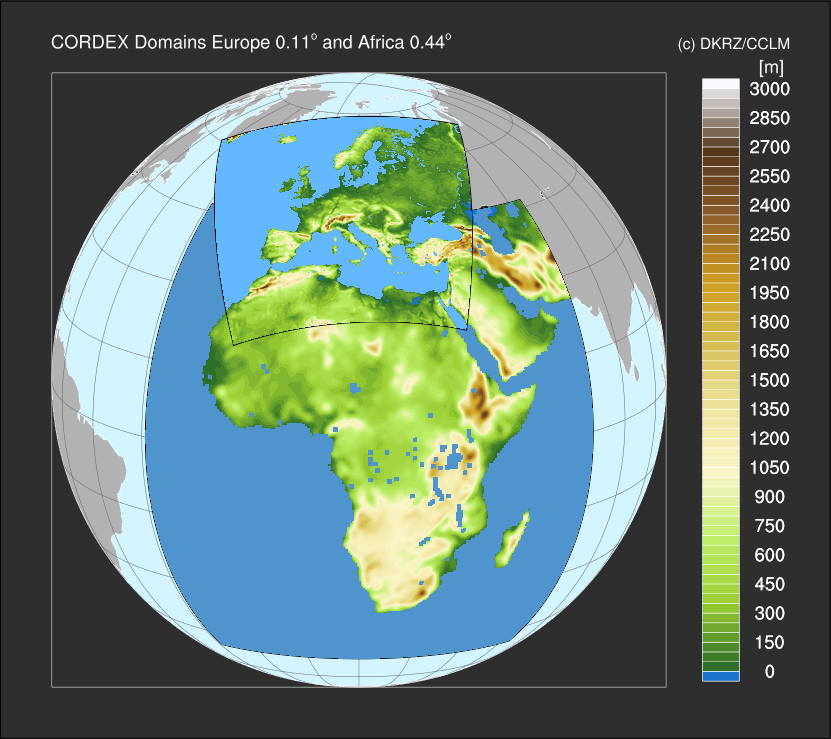
DKRZ NCL two different resolutions on a globe example#
Example script:
;-----------------------------------------------------------------
;
;  DKRZ NCL example:  NCL_globe_orography_grid_resolution.ncl
;
;  Date: 18.06.2013
;-----------------------------------------------------------------
begin
  f1          = addfile("$NCL_TUT/data/HSURF_EUR-11_model_region.nc","r")
  var1        = f1->HSURF(0,:,:)
  mask1       = addfile("$NCL_TUT/data/FR_LAND_EUR-11_model_region.nc","r")
  lsm1        = mask1->FR_LAND(0,:,:)
  lsm1        = where(lsm1.gt.0.5,-9999,lsm1)
  land_only1  = var1
  land_only1  = mask(var1,lsm1,-9999)

  f2          = addfile("$NCL_TUT/data/HSURF_AFR-44_model_region.nc","r")
  var2        = f2->HSURF(0,:,:)
  mask2       = addfile("$NCL_TUT/data/FR_LAND_AFR-44_model_region.nc","r")
  lsm2        = mask2->FR_LAND(0,:,:)
  lsm2        = where(lsm2.gt.0.5,-9999,lsm2)
  land_only2  = var2
  land_only2  = mask(var2,lsm2,-9999)

  lat2d       = f1->lat
  lon2d       = f1->lon
  nlat        = dimsizes(lat2d(:,0))
  nlon        = dimsizes(lon2d(0,:))

;-- open workstation
  wks_type                     = "png"
  wks_type@wkBackgroundColor   = "grey18"
  wks_type@wkForegroundColor   = "white"
  if(wks_type .eq. "pdf" .or. wks_type .eq."ps") then
     wks_type@wkOrientation = "landscape"                ;-- orientation
  else if (wks_type .eq. "png")
     wks_type@wkWidth      =  1024
     wks_type@wkHeight     =  1024
  end if
  end if
  plotfile = "plot_globe_orography_grid_resolution"
  wks  = gsn_open_wks(wks_type, plotfile)

;-- global resources
  res                          = True
  res@gsnDraw                  = False
  res@gsnFrame                 = False

;-- map resources
  mpres                        = res
  mpres@mpProjection           = "Orthographic"
  mpres@mpLabelsOn             = False
  mpres@mpPerimOn              = True
  mpres@mpGridLineColor        = "grey40"
  mpres@mpGridAndLimbOn        = True
  mpres@mpFillOn               = True
  mpres@mpOutlineOn            = True
  mpres@mpOutlineDrawOrder     = "PostDraw"
  mpres@mpFillDrawOrder        = "PreDraw"
  mpres@mpOceanFillColor       = (/ 0.824, 0.961, 1.0 /)
  mpres@mpLandFillColor        = (/ 0.7, 0.7, 0.7 /)
  mpres@mpCenterLatF           = 15.
  mpres@mpCenterLonF           = 15.

  map   = gsn_csm_map(wks,mpres)

;-- AFR-44
  cnres2                       =  res
  cnres2@cnFillOn              =  True
  cnres2@cnMissingValFillColor = "steelblue3"
  cnres2@cnLinesOn             =  False
  cnres2@cnLineLabelsOn        =  False
  cnres2@cnLevelSelectionMode  = "ManualLevels"
  cnres2@cnMinLevelValF        =  0.0
  cnres2@cnMaxLevelValF        =  3000.
  cnres2@cnLevelSpacingF       =  50.
  cnres2@cnFillPalette         = "OceanLakeLandSnow"
  cnres2@cnFillDrawOrder       = "PostDraw"
  cnres2@gsnRightString        = ""
  cnres2@gsnLeftString         = ""
  cnres2@trYReverse            =  True
  cnres2@lbOrientation         = "vertical"
  cnres2@lbLabelFontHeightF    =  0.013
  cnres2@gsnMaximize           =  True
  cnres2@tiXAxisString         = ""
  cnres2@tiYAxisString         = ""

  plot2 = gsn_csm_contour(wks,land_only2,cnres2)

;-- overlay Africa
  overlay(map,plot2)

;-- polyline resources
  resl                         =  True
  resl@gsLineThicknessF        =  2.0
  resl@gsLineColor             = "black"

;-- plot the box around the data field
  xbox = (/-29.04, 64.68, 64.68, -29.04, -29.04/)
  ybox = (/-50.16, -50.16, 46.64, 46.64, -50.16/)
  dum1 = gsn_add_polyline(wks, plot2, xbox, ybox, resl)

;-- delete unnecessary things
  delete(resl)
  delete(cnres2)
  delete(var2)
  delete(mask2)
  delete(lsm2)
  delete(land_only2)

;-- EUR-11
  cnres                        =  res
  cnres@cnFillOn               =  True             ; turn on color
  cnres@cnMissingValFillColor  = "steelblue1"
  cnres@cnLinesOn              =  False            ; no contour lines
  cnres@cnLineLabelsOn         =  False            ; no contour labels
  cnres@cnLevelSelectionMode   = "ManualLevels"    ; Set contour levels manually
  cnres@cnMinLevelValF         =  0.0              ; Minimum contour level
  cnres@cnMaxLevelValF         =  3000.            ; Maximum contour level
  cnres@cnLevelSpacingF        =  50.              ; Contour level spacing
  cnres@cnFillPalette          = "OceanLakeLandSnow"
  cnres@cnFillDrawOrder        = "PostDraw"
  cnres@gsnRightString               = "["+var1@units+"]"
  cnres@gsnRightStringFontHeightF    =  0.013
  cnres@gsnRightStringParallelPosF   =  1.19
  cnres@gsnRightStringOrthogonalPosF = -0.007
  cnres@tiXAxisString          = ""
  cnres@tiYAxisString          = ""

  cnres@gsnLeftString          = ""
  cnres@trYReverse             =  True
  cnres@tfDoNDCOverlay         =  False    ; transform to standard lat/lon
  cnres@sfXArray               =  lon2d
  cnres@sfYArray               =  lat2d
  cnres@lbOrientation          = "vertical"
  cnres@lbLabelFontHeightF     =  0.013
  cnres@gsnMaximize            =  True

;-- overlay Europe
  plot1 = gsn_csm_contour(wks,land_only1,cnres)

;-- polyline resources
  resl                         =  True
  resl@gsLineThicknessF        =  3.0
  resl@gsLineColor             = "black"

;-- define edges
  lon_val_upper = lon2d(nlat-1,:)
  lat_val_upper = lat2d(nlat-1,:)
  lon_val_lower = lon2d(0,:)
  lat_val_lower = lat2d(0,:)
  lon_val_left  = lon2d(:,0)
  lat_val_left  = lat2d(:,0)
  lon_val_right = lon2d(:,nlon-1)
  lat_val_right = lat2d(:,nlon-1)

;-- draw edges
  upper = gsn_add_polyline(wks, plot1, lon_val_upper, lat_val_upper, resl)
  lower = gsn_add_polyline(wks, plot1, lon_val_lower, lat_val_lower, resl)
  left  = gsn_add_polyline(wks, plot1, lon_val_left,  lat_val_left,  resl)
  right = gsn_add_polyline(wks, plot1, lon_val_right, lat_val_right, resl)

  overlay(map,plot1)

;-- draw title strings
  str = "CORDEX Domains Europe 0.11~S~o~N~ and Africa 0.44~S~o~N~"
  txres                        =  True
  txres@txFontHeightF          =  0.013
  txres@txJust                 = "BottomLeft"
  gsn_text_ndc(wks, str, 0.20, 0.82, txres)

  txres@txJust                 = "BottomRight"
  txres@txFontHeightF          =  0.011
  str = "(c) DKRZ/CCLM"
  gsn_text_ndc(wks,str, 0.92, 0.82, txres)

;-- draw the frame
  draw(map)

;-------------------------------------------------------------------
;-- just hold a small border around the plot (later we will cut off not used space from plot)
;-------------------------------------------------------------------
  plres                  =  True
  plres@gsLineColor      = "black"                 ;-- color of lines
  plres@gsLineThicknessF =  2.0                    ;-- thickness of lines

  plx = (/0.15,0.96,0.96,0.15,0.15/)
  ply = (/0.15,0.15,0.87,0.87,0.15/)
  gsn_polyline_ndc(wks,plx,ply,plres)

  frame(wks)                                         ;-- advance the frame
;-------------------------------------------------------------------

;-------------------------------------------------------------------
;-- cut off the  white border
;-------------------------------------------------------------------
  cmd = "convert -alpha off -density 300 -trim "+plotfile+".png tmp9999.png"
  system(cmd)
  system("mv tmp9999.png "+plotfile+".png")

end
Result:
