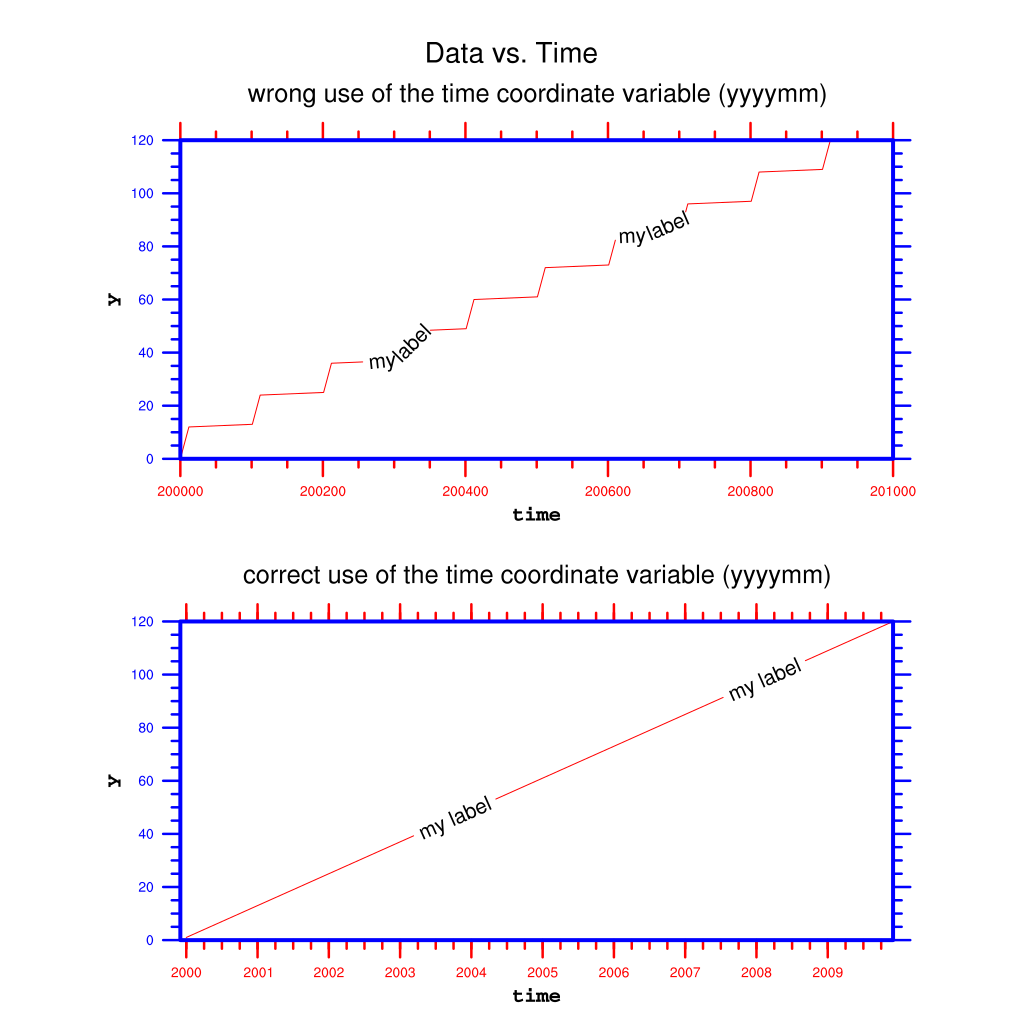
DKRZ NCL using time coordinate variable with units yyyymm#
If the time coordinate variable has the units yyyymm the time values are something like
200001, 200002, 200003,…, 200012, 200101, 200102,…, 200112, 200201,…
These leaps between December and January of a year using the yyyymm format are the reason why a xy-plot looks like a stair. To get the correct x-axis you have to set some additional resources (tmXBMode = “Explicit”, tmXBValues, tmXBMinorValues, tmXBLabels) which are used for the lower plot in the panel.
Example script:
;--------------------------------------------------------------------
; DKRZ NCL exampl: tickmark_resources_xy.ncl
;
; Description:   Demonstrate the correct use of the time coordinate
;                variable (yyyymm)
; 03.07.18 kmf
;--------------------------------------------------------------------
;-- open workstation
 wks_type = "png" ;-- graphic output type
 wks_type@wkWidth = 1200 ;-- width of PNG file
 wks_type@wkHeight = 1200 ;-- height if PNG file
 wks = gsn_open_wks(wks_type,"plot_tickmark_resources_xy")

;-- resource settings
 res = True
 res@gsnDraw = False
 res@gsnFrame = False

;-- x-axis title
 res@tiXAxisString = "time" ;-- x-axis title string
 res@tiXAxisFont = 30 ;-- x-axis title font (courier-bold)
 res@tiXAxisFontHeightF = 0.014 ;-- x-axis title font size

;-- y-axis title
 res@tiYAxisString = "y"    ;-- y-axis title string
 res@tiYAxisFont = 30 ;-- y-axis title font (courier-bold)
 res@tiYAxisFontHeightF = 0.014 ;-- y-axis title font size

;-- axis border line color and thickness
 res@tmBorderLineColor = "blue" ;-- x- and y-axis line color
 res@tmBorderThicknessF = 8. ;-- x- and y-axis line thickness

;-- bottom x-axis label resources
 res@tmXBLabelFontHeightF = 0.012 ;-- bottom x-axis label font size
 res@tmXBLabelFontColor = "red" ;-- bottom x-axis label color

 res@tmXBMajorLineColor = "red" ;-- bottom x-axis major tickmark color
 res@tmXBMinorLineColor = "red" ;-- bottom x-axis minor tickmark color
 res@tmXBMajorThicknessF = 5. ;-- bottom x-axis major tickmarks thickness
 res@tmXBMinorThicknessF = 5. ;-- bottom x-axis minor tickmarks thickness

;-- left y-axis label resources
 res@tmYLLabelFontHeightF = 0.012 ;-- left y-axis label font size
 res@tmYLLabelFontColor = "blue" ;-- left y-axis label color

 res@tmYLMajorLineColor = "blue" ;-- left y-axis major tickmark color
 res@tmYLMinorLineColor = "blue" ;-- left y-axis minor tickmark color
 res@tmYLMajorThicknessF = 5. ;-- left y-axis major tickmarks thickness
 res@tmYLMinorThicknessF = 5. ;-- left y-axis minor tickmarks thickness

;-- viewport settings
 res@vpXF = 0.1 ;-- set viewport x-position
 res@vpYF = 0.89 ;-- set viewport y-position
 res@vpWidthF = 0.85 ;-- set viewport width
 res@vpHeightF = 0.38 ;-- set viewport height

;-- time x-axis settings
 time = yyyymm_time(2000,2009,"integer") ;-- creates a 1D array containing year-month (yyyymm) values

;!!!
;!!! The time array values are now 200001, 200002, 200003,..., 200012, 200101,... !!!
;!!! --------------
;!!! These leaps are the reason why the xy-plot line looks like a stair!
;!!!

 ntime = dimsizes(time) ;-- number of time steps

;-- dummy data settings
 y = ispan(1,ntime,1) ;-- generate data array
 y!0 = "time" ;-- set named dimension time
 y&time = time                                        ;-- reference time coordinate variable

;-- x-axis resource settings
 res@xyLabelMode = "Custom" ;-- xy-plot line label mode
 res@xyExplicitLabels = "my label" ;-- label the xy-plot line
 res@xyLineLabelFontHeightF = 0.018 ;-- size of the label
 res@xyLineThicknessF = 2.0 ;-- xy-plot line thickness
 res@xyLineColor = "red" ;-- xy-plot line color
 res@xyLineDashSegLenF = 0.3                  ;-- distance between xy-plot line labels

;-- title string resources
 res@tiMainFontHeightF = 0.022 ;-- title font size
 res@tiMainString = "wrong use of the time coordinate variable (yyyymm)" ;-- title string

;-- create the plot in memory
 plot1 = gsn_csm_xy(wks,time,y,res)

;--------------------------------------------------------------------
;-- second plot
;--------------------------------------------------------------------
;-- generate time index and years arrays for explicit x-axis use
 inttime = ispan(1,ntime,1) ;-- create an index array for x-axis dimension time
 years = str_get_cols(tostring(time),0,3) ;-- retrieve the years

;-- generate the time axis labels
 tlabels = new(ntime,"string") ;-- create new array for time x-axis labels
 tlabels = "" ;-- initialize tlabels array
 yr = years(0) ;-- init yr
 tlabels(0) = yr ;-- first label

 do i=1,ntime-1
    if(years(i) .ne. yr) then
       tlabels(i) = years(i) ;-- we want only the first year entries of years array
       yr = years(i) ;-- next year
    end if
 end do

;-- x-axis resource settings
 res@tmXBMode = "Explicit" ;-- explicit setting of tick marks and labels
 res@tmXBValues = inttime(::12) ;-- locations for major tick marks
 res@tmXBMinorValues = inttime(::3) ;-- locations for minor tick marks (tmXBMode "Ecplicit")
 res@tmXBLabels = tlabels(::12) ;-- labels of major tick marks

;-- change the title string
 res@tiMainString = "correct use of the time coordinate variable (yyyymm)" ;-- title string

;-- create the plot in memory
 plot2 = gsn_csm_xy(wks,inttime,y,res)

;-- panel resources
 pres = True
 pres@gsnPanelYWhiteSpacePercent = 5 ;-- more space between the plots
 pres@gsnPanelMainString = "Data vs. Time" ;-- panel title string

;-- plot the panel and advance the frame
 gsn_panel(wks,(/plot1,plot2/),(/2,1/),pres)
Result:
