DKRZ NCL vector plot colorized by variable example#
DKRZ NCL example script:
;---------------------------------------------------
; DKRZ NCL Examples: NCL_vector_plot_colorized.ncl
;
; 30.10.14 kmf
;---------------------------------------------------
;-- define file and variable names
diri = "./"
fili = "rectilinear_grid_2D.nc"
uname = "u10"
vname = "v10"
tname = "tsurf"
;-- read the data
f = addfile(diri+fili,"r") ;-- open file with read access
u = f->$uname$(0,:,:) ;-- first time step
v = f->$vname$(0,:,:) ;-- first time step
t = f->$tname$(0,:,:) ;-- first time step
;-- define the workstation (graphic will be written to a file)
wks = gsn_open_wks("png","plot_vector_colorized")
gsn_define_colormap(wks,"ncl_default") ;-- choose color map
;-- set plot resources
res = True
res@gsnMaximize = True ;-- maxmize plot in frame
res@vcMinFracLengthF = 1.0 ;-- length of min vector as fraction of reference vector.
res@vcRefMagnitudeF = 3.0 ;-- make vectors larger
res@vcRefLengthF = 0.045 ;-- ref vec length
res@vcGlyphStyle = "CurlyVector" ;-- turn on curly vectors
res@vcMinDistanceF = 0.01 ;-- thin out vectors
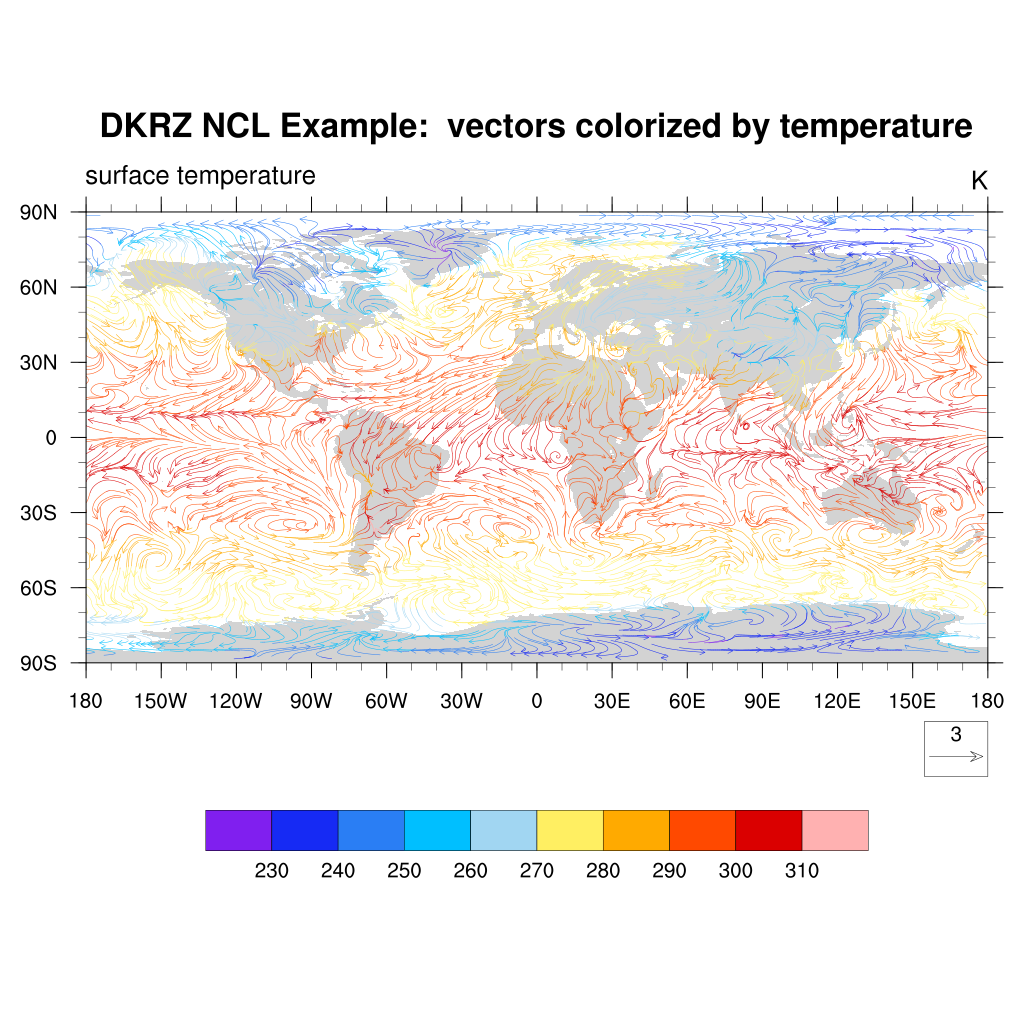
res@tiMainString = "DKRZ NCL Example: vectors colorized by temperature" ;-- set title string
;-- draw the vectors
plot = gsn_csm_vector_scalar_map_ce(wks,u,v,t,res)
Result: