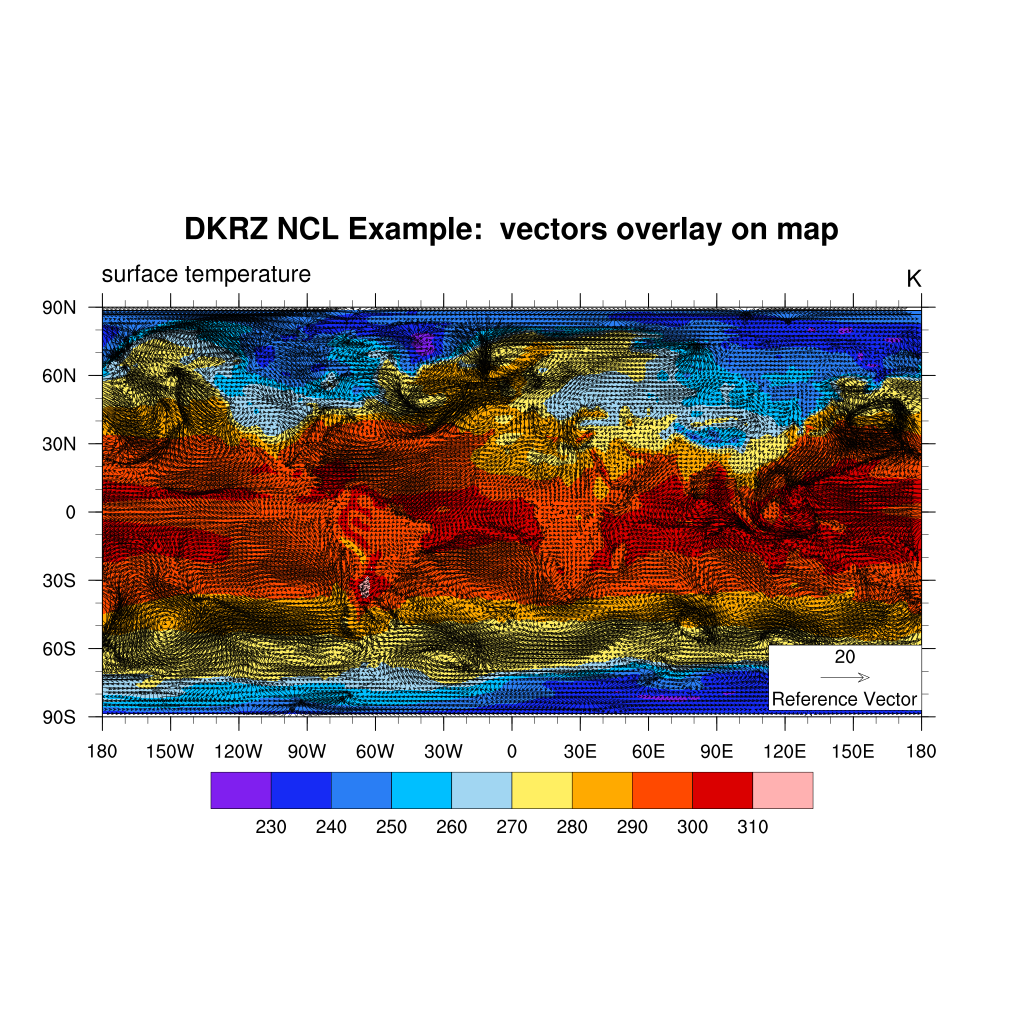
DKRZ NCL vector plot on contour plot example#
DKRZ NCL example script:
;---------------------------------------------------
;  NCL Doc Examples:   NCL_vector_overlay.ncl
;
;  30.10.14 kmf
;---------------------------------------------------
;-- define file and variable names
  diri  = "./"
  fili  = "rectilinear_grid_2D.nc"
  uname = "u10"
  vname = "v10"
  tname = "tsurf"

;-- read the data
   f   =  addfile(diri+fili,"r")               ;-- open file with read access
   u   =  f->u10(0,:,:)                     ;-- first time step
   v   =  f->v10(0,:,:)                     ;-- first time step
   t   =  f->tsurf(0,:,:)                       ;-- first time step

;-- define the workstation (graphic will be written to a file)
   wks =  gsn_open_wks("png","plot_vector_overlay")
   gsn_define_colormap(wks,"ncl_default")      ;-- choose color map

;-- set contour plot resources
   cnres                     = True
   cnres@gsnDraw             = False           ;-- don't draw
   cnres@gsnFrame            = False           ;-- don't advance frame
   cnres@cnFillOn            = True            ;-- turn on color
   cnres@cnLinesOn           = False           ;-- no contour lines
   cnres@mpFillOn            = False           ;-- no map fill
   cnres@gsnLeftString       = "surface temperature"  ;-- change left string
   cnres@gsnRightString      = t@units         ;-- assign right string
   cnres@tiMainString        = "DKRZ NCL Example:  vectors overlay on map"

;-- set vector plot resources
   vcres                     = True            ;-- vector only resources
   vcres@gsnDraw             = False           ;-- don't draw
   vcres@gsnFrame            = False           ;-- don't advance frame
   vcres@vcGlyphStyle        = "CurlyVector"   ;-- curly vectors
   vcres@vcRefMagnitudeF     = 20              ;-- define vector ref mag
   vcres@vcRefLengthF        = 0.045           ;-- define length of vec ref
   vcres@vcRefAnnoOrthogonalPosF = -.535       ;-- move ref vector into plot
   vcres@gsnRightString      = " "             ;-- turn off right string
   vcres@gsnLeftString       = " "             ;-- turn off left string
   vcres@tiXAxisString       = " "             ;-- turn off axis label

;-- create the plots
   cplot  = gsn_csm_contour_map_ce(wks,t,cnres)
   vplot  = gsn_csm_vector(wks,u,v,vcres)

;-- overlay vector plot on contour plot
   overlay(cplot,vplot)

   draw(cplot)
   frame(wks)
Result: