DKRZ NCL vectors on a curvilinear grid example#
Example script:
;---------------------------------------------------
;-- DKRZ NCL example: NCL_vector_plot_curvilinear.ncl
;--
;-- 08.04.16 kmf
;---------------------------------------------------
begin
fu = addfile("$HOME/data/Ocean/uo_mon_t1.nc","r")
fv = addfile("$HOME/data/Ocean/vo_mon_t1.nc","r")
u = fu->uo(0,0,:,:)
u@lat2d = fu->lat
u@lon2d = fu->lon
v = fv->vo(0,0,:,:)
v@lat2d = fv->lat
v@lon2d = fv->lon
minlat = 40.
maxlat = 60.
minlon = -20.
maxlon = 20.
;-- define the workstation (graphic will be written to a file)
wks_type = "png"
wks_type@wkWidth = 1200
wks_type@wkHeight = 1200
wks = gsn_open_wks(wks_type,"plot_vector_curvilinear")
;-- set plot resources
res = True
res@gsnDraw = False
res@gsnFrame = False
res@gsnMaximize = True
res@gsnAddCyclic = False
vcres = res
res@gsnLeftString = ""
res@gsnRightString = ""
res@cnFillOn = True ;-- turn on contour fill
res@cnFillMode = "CellFill" ;-- change contour fill mode
res@cnLinesOn = False ;-- don't draw contour lines
res@cnCellFillEdgeColor = "blue" ;-- edges color
res@cnCellFillMissingValEdgeColor = "grey" ;-- missing edges color
res@cnMonoFillColor = True ;-- we want to see only the grid
res@cnFillColor = -1 ;-- color is set to transparent
res@cnLineLabelsOn = False
res@lbLabelBarOn = False
res@sfYArray = u@lat2d
res@sfXArray = u@lon2d
res@mpFillOn = False ;-- don't draw filled map
res@mpDataBaseVersion = "MediumRes" ;-- use medium resolution map
res@mpProjection = "Orthographic"
res@mpCenterLatF = 20
res@mpCenterLonF = 0
res@mpLimitMode = "Corners" ;-- map limit mode
res@mpLeftCornerLatF = minlat ;-- min lat
res@mpRightCornerLatF = maxlat ;-- max lat
res@mpLeftCornerLonF = minlon ;-- min lon
res@mpRightCornerLonF = maxlon ;-- max lon
vcres@gsnLeftString = ""
vcres@gsnRightString = ""
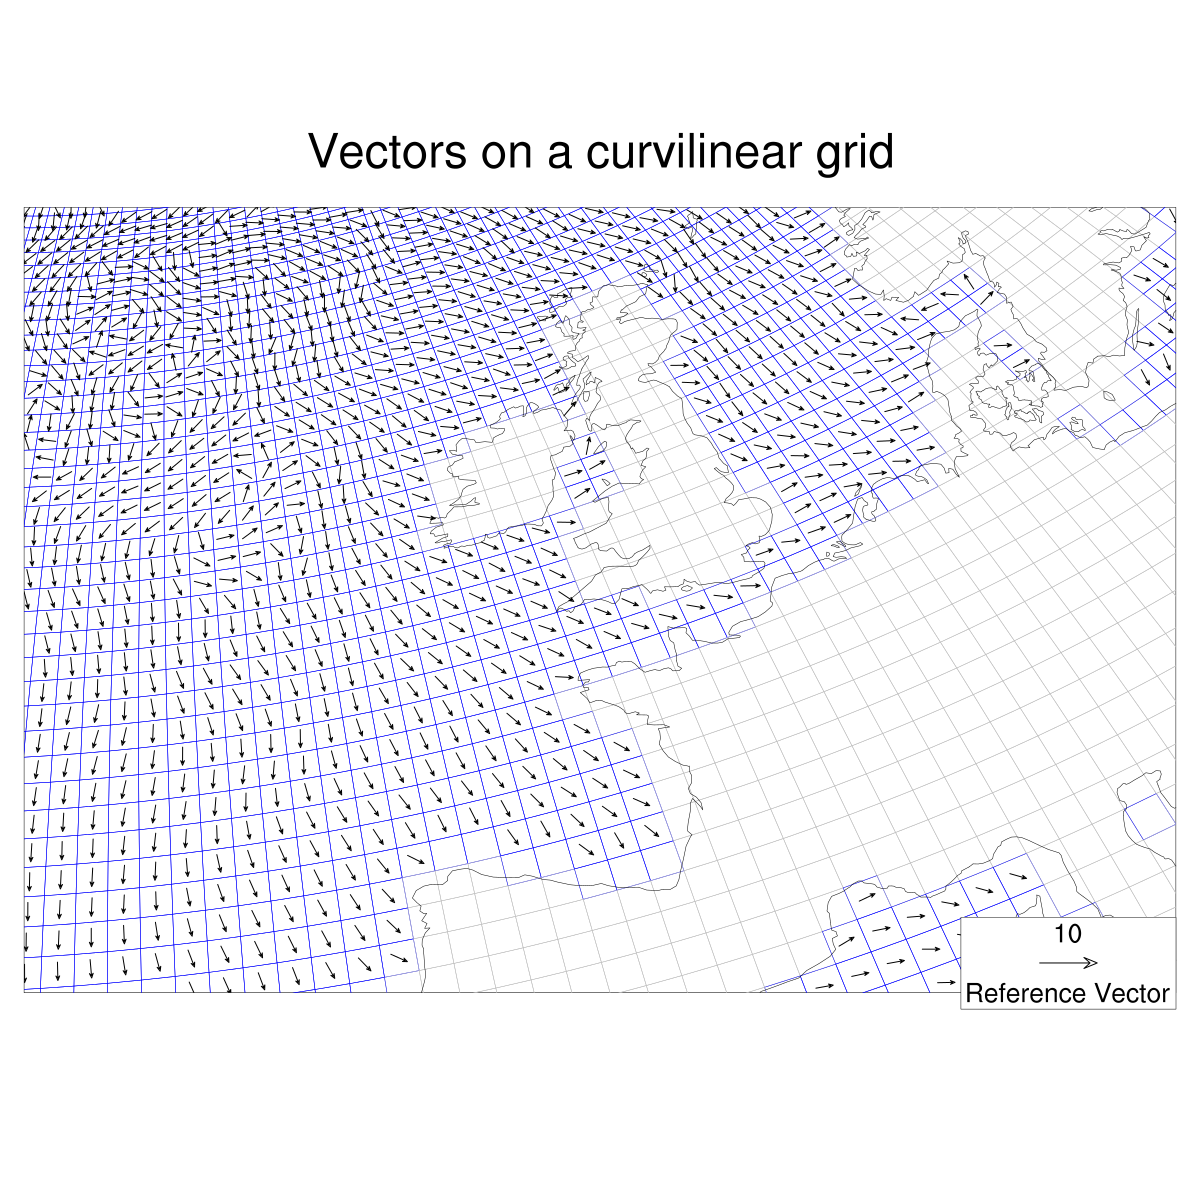
vcres@tiMainString = "Vectors on a curvilinear grid" ;-- turn off axis label
vcres@tiMainFontHeightF = 0.018
vcres@vcRefLengthF = 0.03 ;-- length of reference vector
vcres@vcMinFracLengthF = 0.3 ;-- length of smallest vector
vcres@vcLineArrowThicknessF = 2.0 ;-- make vectors thicker
vcres@vcRefMagnitudeF = 10 ;-- define vector ref mag
vcres@vcRefLengthF = 0.035 ;-- define length of vec ref
vcres@vcRefAnnoOrthogonalPosF = -.096 ;-- move ref vector into plot
vcres@vfXArray = u@lon2d ;-- transform x to mesh scalar field
vcres@vfYArray = u@lat2d ;-- transform y to mesh scalar field
cnplot = gsn_csm_contour_map(wks,u,res)
vcplot = gsn_csm_vector(wks,u,v,vcres)
overlay(cnplot,vcplot)
draw(cnplot)
frame(wks)
end
Result: