DKRZ NCL xy-plot example coloring between lines#
Example script:
;--------------------------------------------------------------------
; DKRZ NCL example: NCL_transparent_filled_curves.ncl
;
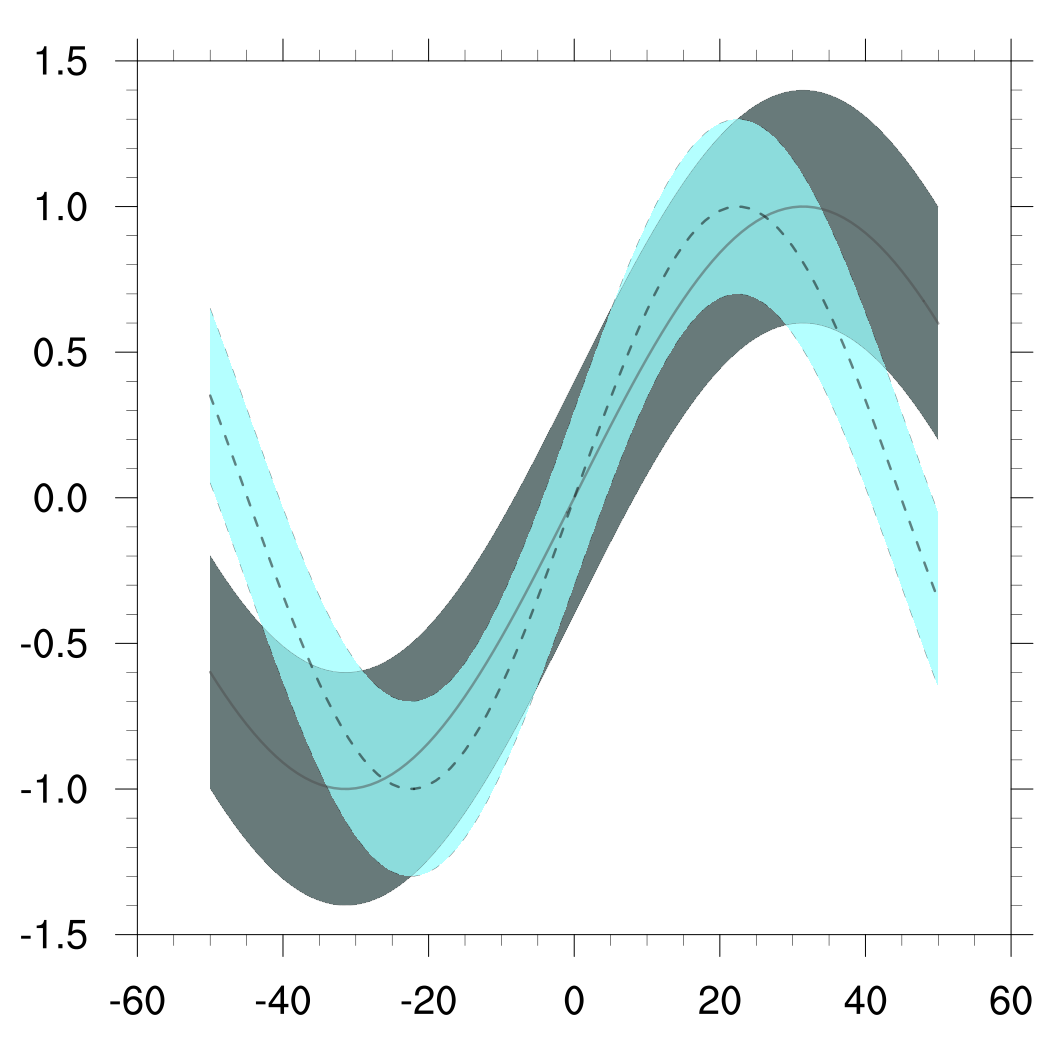
; Description: Use dummy data.
; Draw two curves with 'pseudo standard deviations' and
; fill the areas between the lines with colors. Use
; transparency to make the underlying curve visible.
;
; 01.03.18 kmf
;--------------------------------------------------------------------
begin
;-- compute test data for two curves with 'pseudo stddev'
x = ispan(-50,50,1)
y1 = sin(0.05*x)
ystdp1 = y1 + 0.4
ystdm1 = y1 - 0.4
y2 = sin(0.07*x)
ystdp2 = y2 + 0.3
ystdm2 = y2 - 0.3
;-- set colors
cdsg0 = (/0.2,0.3,0.3,0.5/) ;-- darkslategray
cdsg1 = (/0.6,1.0,1.0,0.5/) ;-- darkslategray1
cblack = (/0.0,0.0,0.0,0.5/)
cgray = (/0.3,0.3,0.3,0.5/)
;-- set above, below and line colors for both curves
belowcols1 = (/cdsg0,cdsg0/)
belowcols2 = (/cdsg1,cdsg1/)
abovecols1 = belowcols1
abovecols2 = belowcols2
;-- line settings
linecol1 = cgray ;-- line color 1st curve
linecol2 = cblack ;-- line color 2nd curve
linepattern1 = 0 ;-- line dash pattern 1st curve
linepattern2 = 14 ;-- line dash pattern 2nd curve
linewidth = (/1,5,1/) ;-- linewidth (lower, middle, upper)
;-- open workstation
wks_type = "png"
wks_type@wkWidth = 1200
wks_type@wkHeight = 1200
wks = gsn_open_wks(wks_type,"plot_transparent_filled_curves")
;-- set resources
res = True
res@gsnDraw = False ;-- don't draw the plots, yet
res@gsnFrame = False ;-- don't advance the frame
res@gsnMaximize = True ;-- maximize the plot
res@xyMonoDashPattern = True ;-- use a solid lines for all curves
res@xyDashPattern = linepattern1 ;-- line pattern
res@xyLineThicknesses = linewidth ;-- line width
res@xyLineColor = linecol1 ;-- line color
res@gsnXYBelowFillColors = belowcols1 ;-- use color between below lines
res@gsnXYAboveFillColors = abovecols1 ;-- use color between above lines
res@trYMinF = -1.5 ;-- y-axis minimum
res@trYMaxF = 1.5 ;-- y-axis maximum
;-- define data arrays for both curves and plot them
;-- first plot
data1 = (/ystdm1, y1, ystdp1/)
plot1 = gsn_csm_xy(wks,x,data1,res)
res@xyLineColor = linecol2 ;-- line color
res@xyDashPattern = linepattern2 ;-- line pattern
res@gsnXYBelowFillColors = belowcols2 ;-- use color between below lines
res@gsnXYAboveFillColors = abovecols2 ;-- use color between above lines
;-- second plot
data2 = (/ystdm2, y2, ystdp2/)
plot2 = gsn_csm_xy(wks,x,data2,res)
;-- overlay both plots
overlay(plot1,plot2)
;-- draw the plot and advance the frame
draw(plot1)
frame(wks)
end
Result: