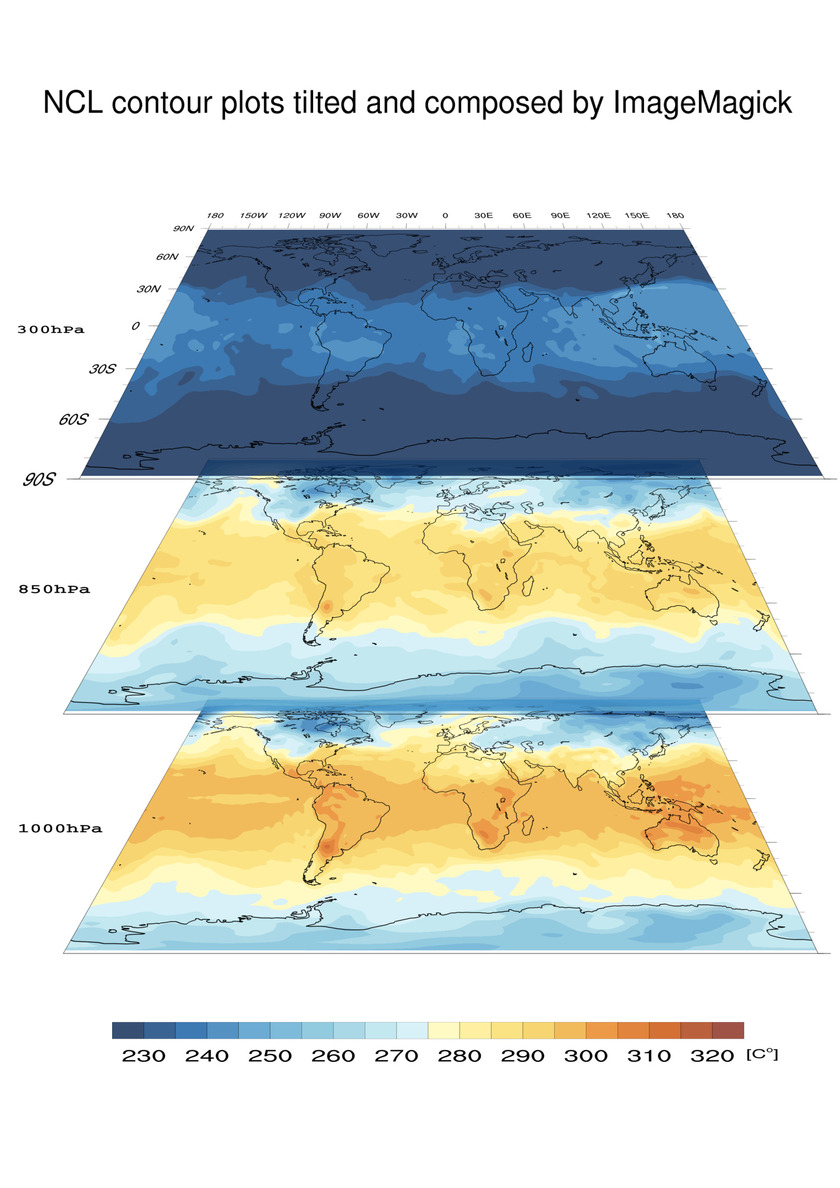
NCL/ImageMagick example to tilt 3 contour plots into one new image#
Run the following KSH script:
ksh Tilting_3_Plots.ksh
Example KSH script Tilting_3_Plots.ksh:
#!/bin/ksh
#-----------------------------------------------------------------------------------
# DKRZ NCL example:  Tilting_3_Plots.ksh
#
# Description: KSH-script to create 3 contour, 1 title and 1 labelbar plot
# generated by an NCL script, tilt the contour plots, and
#   compose all with ImageMagick's 'convert' to one in portrait
# format.
#
# Graphic Software: NCL 6.3.0
# Image manipulation: ImageMagick 6.9.1-7
#
# 22.07.16 meier-fleischer(at)dkrz.de
#-----------------------------------------------------------------------------------
 RUN_NCL=1   #-- run/skip NCL (1: do it; 0: skip)
 RUN_COMPOSE=1   #-- run/skip ImageMagick distort/composite (1: do it; 0: skip)

 NCL_SCRIPT="contour_plot.ncl"   #-- name of the NCL script to be created (see below)

 IFILE="rectilinear_grid_3D.nc"      #-- data input file

#***********************************************
#-------------------------------
#-- write NCL script
#-------------------------------
 cat << EOF > ${NCL_SCRIPT}
;---------------------------------------------------------------
; DKRZ NCL example: ${NCL_SCRIPT}
;
; Description: Create a contour plot in one frame,
; title and labelbar in another frame each.
;
;     This script is part of the Pseudo_3D_plots
;     examples to generate 3D looking images.
;
; NCL Version:  6.3.0
;
; 22.07.16 meier-fleischer(at)dkrz.de
;---------------------------------------------------------------
begin

 title = "NCL contour plots tilted and composed by ImageMagick"

 f = addfile("${IFILE}","r") ;-- open input file
 var = f->t ;-- read variable

;-- lev = 100000, 92500, 85000, 77500, 70000, 60000, 50000, 40000, 30000, 25000,
;-- 20000, 15000, 10000, 7000, 5000, 3000, 1000 ;

 slev = (/0,2,8/) ;-- choose levels for data to be plotted

;-- contour plot workstation
 wks_type = "png"
 wks_type@wkWidth = 2500
 wks_type@wkHeight = 2500
 wks_type@wkForegroundColor = "black"
 wks_type@wkBackgroundOpacityF = 0.0
 wks = gsn_open_wks(wks_type, "plot_contour")

;-- title plot workstation
 wkst_type = "png"
 wkst_type@wkWidth = 2500
 wkst_type@wkHeight = 2500
 wkst = gsn_open_wks(wkst_type, "plot_title")

;-- labelbar plot workstation
 wksl_type = "png"
 wksl_type@wkWidth = 2500
 wksl_type@wkHeight = 2500
 wksl = gsn_open_wks(wksl_type, "plot_labelbar")

;-- read color map and make the colors slightly transparent
 cmap = read_colormap_file("BlueYellowRed") ;-- read RGBA colormap
 cmap(:,3) = 0.8 ;-- 0: full transparent, 1: full opaque

;-------------------------------
;-- Contour plot:
;-------------------------------
 res = True
 res@gsnLeftString = "" ;-- no left string
 res@gsnRightString = "" ;-- no right string

 res@cnFillOn = True
 res@cnFillPalette = cmap ;-- set color map
 res@cnLinesOn = False ;-- turn off contour lines
 res@cnLineLabelsOn = False ;-- turns off contour line labels
 res@cnInfoLabelOn = False ;-- turns off contour info label
 res@cnMissingValFillColor = "wheat4" ;-- missing value color
 res@cnMissingValFillPattern = 0 ;-- 0: solid fill
 res@cnLevelSelectionMode = "ManualLevels" ;-- use manual contour line levels
 res@cnMinLevelValF = 230.0 ;-- contour min. value
 res@cnMaxLevelValF = 320.0 ;-- contour max. value
 res@cnLevelSpacingF = 5.0 ;-- contour interval

 res@tmXTOn = True ;-- turn on tickmarks at top axis
 res@tmXTLabelsOn = True ;-- draw tickmark labels
 res@tmXTMajorLineColor = "black" ;-- choose top x-axis color
 res@tmXTLabelFontColor = "black" ;-- choose top x-axis label color
 res@tmXUseBottom = False ;-- do not use bottom x-axis

 res@tmXBOn = False ;-- turn off tickmarks at bottom axis

 res@tmYLOn = True ;-- turn on tickmarks at left axis
 res@tmYLLabelsOn = True ;-- draw tickmark labels
 res@tmYLMajorLineColor = "black" ;-- choose left y-axis color
 res@tmYLLabelFontColor = "black" ;-- choose left y-axis label color
 res@tmYUseLeft = True ;-- use left y-axis

 res@mpGeophysicalLineThicknessF = 4.0 ;-- increase coastal outlines thicker
 res@mpFillOn = False ;-- do not fill land areas

 res@lbLabelBarOn = False ;-- don't draw labelbar

 contour = gsn_csm_contour_map(wks,var(0,slev(2),:,:),res) ;-- create plot; advance contour frame
 print(" - contour plot done: level = "+sprinti("%4i",toint(f->lev(slev(2))/100))+" hPa")

 res@tmXTOn = False ;-- turn on tickmarks at top axis
 res@tmYLOn = False ;-- turn on tickmarks at top axis

 contour = gsn_csm_contour_map(wks,var(0,slev(1),:,:),res) ;-- create plot; advance contour frame
 print(" - contour plot done: level = "+sprinti("%4i",toint(f->lev(slev(1))/100))+" hPa")
 contour = gsn_csm_contour_map(wks,var(0,slev(0),:,:),res) ;-- create plot; advance contour frame
 print(" - contour plot done: level = "+sprinti("%4i",toint(f->lev(slev(0))/100))+" hPa")

;-------------------------------
;-- Title plot:
;-------------------------------
 tires = True
 tires@txJust = "CenterCenter" ;-- text justification
 tires@txFontHeightF = 0.017 ;-- text font size

 tix = 0.5
 tiy = 0.8

 gsn_text_ndc(wkst,title,tix,tiy,tires) ;-- draw title
 print(" - title plot done")

 frame(wkst) ;-- advance title frame

;-------------------------------
;-- Labelbar plot:
;-------------------------------
;-- retrieve the contour resources for the labelbar
 getvalues contour@contour
    "cnLevels" : cnlevs ;-- contour levels
    "cnFillColors" : cncols ;-- contour colors
    "cnMonoFillPattern" : mpattern ;-- contour fill pattern
 end getvalues

 labels = ""+cnlevs ;-- labelbar labels
 nboxes = dimsizes(cnlevs)+1 ;-- number of color boxes

 lbx = 0.1 ;-- labelbar x-position
 lby = 0.9 ;-- labelbar y-position
 lbw = 0.8 ;-- labelbar width
 lbh = 0.25 ;-- labelbar height

;-- labelbar resources
 lbres = True
 lbres@lbAutoManage = False ;-- we want to control the labelbar
 lbres@lbOrientation = "horizontal" ;-- labelbar orientation
 lbres@lbLabelFontHeightF = 0.024 ;-- increase label font size
 lbres@lbLabelFontThicknessF = 4. ;-- increase label font thickness
 lbres@lbLabelStride = 2 ;-- label every value
 lbres@lbPerimOn = False ;-- no box around labelbar
 lbres@lbLabelFontColor = "black" ;-- labe font color
 lbres@lbLabelAlignment = "InteriorEdges" ;-- where to draw the labels
 lbres@lbMonoFillPattern = mpattern ;-- use same fill pattern as contour plot
 lbres@lbMonoFillColor = False ;-- use multiple colors
 lbres@lbFillColors = cncols ;-- contour colors
 lbres@lbLabelStrings = labels ;-- contour labels
 lbres@lbBoxMinorExtentF = 0.15 ;-- change height of labelbar boxes

 lbres@vpWidthF = lbw ;-- labelbar viewport width
 lbres@vpHeightF = lbh ;-- labelbar viewport height

 gsn_labelbar_ndc(wksl,nboxes,labels,lbx,lby,lbres) ;-- draw labelbar

;-- text resources labelbar annotations
 txres = True
 txres@txFontHeightF = 0.018 ;-- units text font size

 gsn_text_ndc(wksl, "[C~S~o~N~]", 0.91, 0.75, txres) ;-- add units to labelbar
 print(" - labelbar plot done")

 frame(wksl) ;-- advance labelbar frame

 print("")

end
EOF

#***********************************************
#-------------------------------------------------------------------
#-- run NCL scripts to generate the input images
#-------------------------------------------------------------------
 if [[ $RUN_NCL == 1 ]] ; then
    rm -rf plot_*.png #-- delete all old plots

    echo "--------------------------------------------"
    echo "** run NCL"
    ncl -Q -n ${NCL_SCRIPT} #-- run NCL without standard output
 fi

#-------------------------------------------------------------------
#-- do the tilting of the plot and create the composed plot
#-------------------------------------------------------------------
 if [[ $RUN_COMPOSE == 1 ]] ; then
    echo "--------------------------------------------"
    echo "** run ImageMagick"

    rm -rf compose.png #-- delete old composed file

    #-- new width and height of sheared images 1685x2383
    co1="plot_contour.000001.png"
    co2="plot_contour.000002.png"
    co3="plot_contour.000003.png"
    co_width=2000 ; co_height=600
    dxco1=25 ; dxco2=25 ; dxco3=1
    dyco1=1370 ; dyco2=890 ; dyco3=400
    angle=-40

    #-- labelbar horizontal
    lb="plot_labelbar.png"
    lb_width=1335 ; lb_height=80
    dxlb=225 ; dylb=2050

    #-- title string
    ti="plot_title.png"
    ti_width=1500 ; ti_height=60
    dxti=90 ; dyti=180

    #-- cut off white space around te plot
    alpha=on
    bgc=white

    convert -alpha $alpha -background $bgc -density 300 -trim $co1 tmp_c1.png
    convert -alpha $alpha -background $bgc -density 300 -trim $co2 tmp_c2.png
    convert -alpha $alpha -background $bgc -density 300 -trim $co3 tmp_c3.png
    convert -alpha $alpha -background $bgc -density 300 -trim $ti tmp_t.png
    convert -alpha $alpha -background $bgc -density 300 -trim $lb tmp_l.png

    echo " - crop white space done"

    #-- original and new coordinate positions of the edges for distortion
    xul=0 ; dxul=400
    yul=0 ; dyul=50

    xur=2200 ; dxur=1500
    yur=0 ; dyur=50

    xlr=2200 ; dxlr=1900
    ylr=1200 ; dylr=1200

    xll=0 ; dxll=0
    yll=1200 ; dyll=1200

    #-- do the distortion and write the result to a temporary file
    convert tmp_c1.png -alpha $alpha -virtual-pixel transparent \
            -distort Perspective "$xul,$yul $dxul,$dyul \
             $xur,$yur $dxur,$dyur \
             $xlr,$ylr $dxlr,$dylr \
             $xll,$yll $dxll,$dyll" tmp_contour_1.png

    #-- do the distortion and write the result to a temporary file
    convert tmp_c2.png -alpha $alpha -virtual-pixel transparent \
            -distort Perspective "$xul,$yul $dxul,$dyul \
             $xur,$yur $dxur,$dyur \
             $xlr,$ylr $dxlr,$dylr \
             $xll,$yll $dxll,$dyll" tmp_contour_2.png

    #-- do the distortion and write the result to a temporary file
    convert tmp_c3.png -alpha $alpha -virtual-pixel transparent \
            -distort Perspective "$xul,$yul $dxul,$dyul \
             $xur,$yur $dxur,$dyur \
             $xlr,$ylr $dxlr,$dylr \
             $xll,$yll $dxll,$dyll" tmp_contour_3.png

    echo " - distortion done"

    #-- compose all images a one new image of size (16:9 1688x3000)
    font=Courier-Bold

    convert -size 1685x2383 xc: \
       \( tmp_contour_3.png -font $font -pointsize 42 -draw "text 10,500 '1000hPa'" -resize ${co_width}x${co_height}! \) \
       -geometry +${dxco1}+${dyco1} -composite \
       \( tmp_contour_2.png -font $font -pointsize 42 -draw "text 10,500 '850hPa'" -resize ${co_width}x${co_height}! \) \
       -geometry +${dxco2}+${dyco2} -composite \
       \( tmp_contour_1.png -font $font -pointsize 42 -draw "text 35,500 '300hPa'" -resize ${co_width}x${co_height}! \) \
       -geometry +${dxco3}+${dyco3} -composite \
       \( tmp_l.png -resize ${lb_width}x${lb_height}! \) -geometry +${dxlb}+${dylb} -composite \
       \( tmp_t.png -resize ${ti_width}x${ti_height}! \) -geometry +${dxti}+${dyti} -composite \
       tmp_compose.jpg

    echo " - composition done"

    #-- resize image to standard A3 842x1188(1920x1080) pixel size
    convert -resize 842x1188 tmp_compose.jpg compose_3_tilted_plots.jpg

    #-- clean up
    rm -rf tmp_*.png tmp_*.jpg
 fi

 echo "--------------------------------------------"
#-------------------------------------------------------------------
 exit
Result: