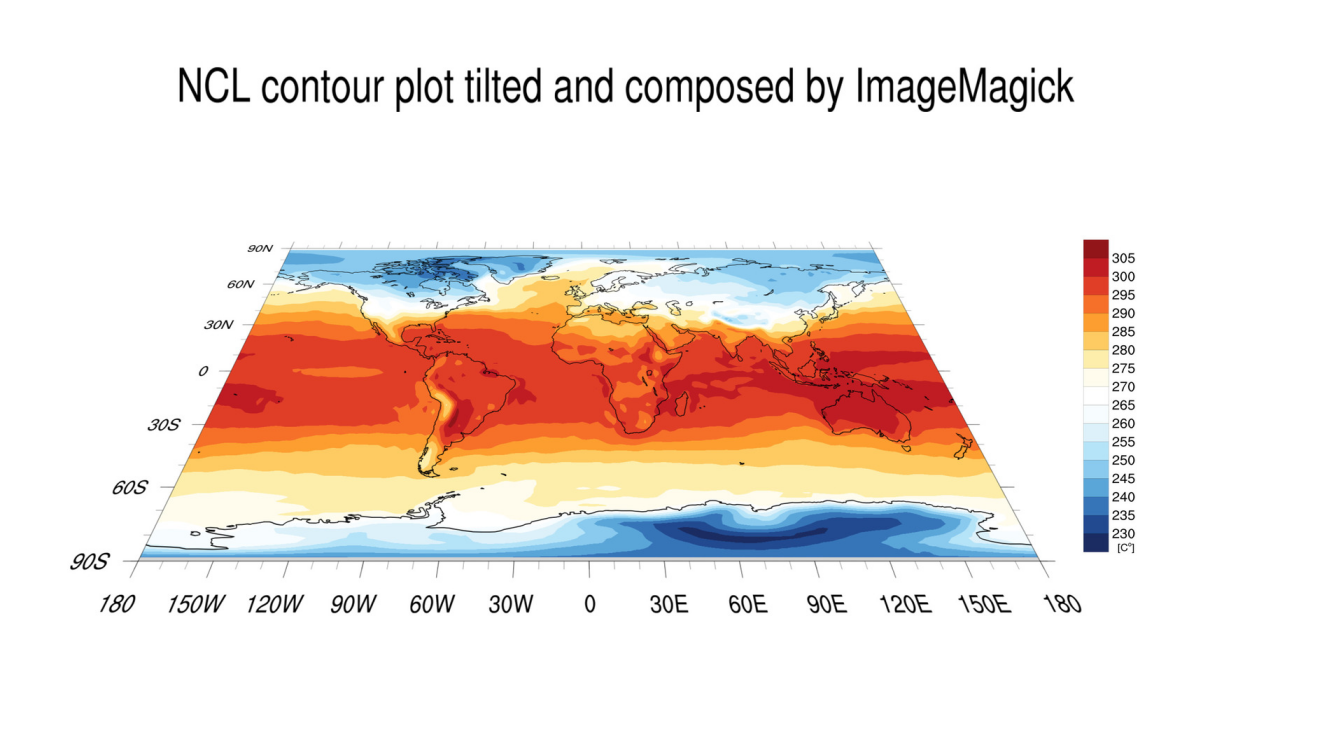
NCL/ImageMagick example to tilt a contour plot#
Run the Korn-Shell script Tilting_Plot.ksh:
ksh Tilting_Plot.ksh
Example Korn-Shell script:
#!/bin/ksh
#-----------------------------------------------------------------------------------
# DKRZ NCL example:  Tilting_Plot.ksh
#
# Description: KSH-script to create contour, title and labelbar plot
# generated by an NCL script, tilt the contour plot, and
#   compose all with ImageMagick's 'convert' to one.
#
# Graphic Software: NCL 6.3.0
# Image manipulation: ImageMagick 6.9.1-7
#
# 22.07.16 meier-fleischer(at)dkrz.de
#-----------------------------------------------------------------------------------
 RUN_NCL=1 #-- run/skip NCL (1: do it)
 RUN_COMPOSE=1 #-- run/skip ImageMagick distort/composite (1: do it)

 NCL_SCRIPT="contour_plot.ncl" #-- name of the NCL script

 IFILE="tas_rectilinear_grid_2D.nc" #-- input file

#***********************************************
#-------------------------------
#-- write NCL script
#-------------------------------

 cat << EOF > ${NCL_SCRIPT}
;--------------------------------------------------------
; DKRZ NCL example: ${NCL_SCRIPT}
;
; Description: Create a contour plot in one frame,
; title and labelbar in another frame each.
;
;     This script is part of the Pseudo_3D_plots
;     examples to generate 3D looking images.
;
; NCL Version:  6.3.0
;
; 22.07.16 meier-fleischer(at)dkrz.de
;--------------------------------------------------------
begin

 title = "NCL contour plot tilted and composed by ImageMagick"

 f = addfile("${IFILE}","r") ;-- open input file
 var = f->tas(0,:,:) ;-- read variable first time step

;-- contour plot workstation
 wks_type = "png"
 wks_type@wkWidth = 2500
 wks_type@wkHeight = 2500
 wks = gsn_open_wks(wks_type, "plot_contour")

;-- title plot workstation
 wkst_type = "png"
 wkst_type@wkWidth = 2500
 wkst_type@wkHeight = 2500
 wkst = gsn_open_wks(wkst_type, "plot_title")

;-- labelbar plot workstation
 wksl_type = "png"
 wksl_type@wkWidth = 2500
 wksl_type@wkHeight = 2500
 wksl = gsn_open_wks(wksl_type, "plot_labelbar")

;-------------------------------
;-- Contour plot:
;-------------------------------
 res = True
 res@gsnLeftString = "" ;-- no left string
 res@gsnRightString = "" ;-- no right string

 res@cnFillOn = True
 res@cnLinesOn = False ;-- turn off contour lines
 res@cnLineLabelsOn = False ;-- turns off contour line labels
 res@cnInfoLabelOn = False ;-- turns off contour info label
 res@cnMissingValFillColor = "wheat4" ;-- missing value color
 res@cnMissingValFillPattern = 0 ;-- 0: solid fill

 res@mpGeophysicalLineThicknessF = 4.0 ;-- increase coastal outlines thicker

 res@lbLabelBarOn = False ;-- don't draw labelbar

 contour = gsn_csm_contour_map(wks,var,res) ;-- create plot; advance contour frame
 print(" - contour plot done")

;-------------------------------
;-- Title plot:
;-------------------------------
 tires = True
 tires@txJust = "CenterCenter" ;-- text justification
 tires@txFontHeightF = 0.017 ;-- text font size

 tix = 0.5
 tiy = 0.8

 gsn_text_ndc(wkst,title,tix,tiy,tires) ;-- draw title
 print(" - title plot done")

 frame(wkst) ;-- advance title frame

;-------------------------------
;-- Labelbar plot:
;-------------------------------
;-- retrieve the contour resources for the labelbar
 getvalues contour@contour
    "cnLevels" : cnlevs ;-- contour levels
    "cnFillColors" : cncols ;-- contour colors
    "cnMonoFillPattern" : mpattern ;-- contour fill pattern
 end getvalues

 labels = ""+cnlevs ;-- labelbar labels
 nboxes = dimsizes(cnlevs)+1 ;-- number of color boxes

 lbx = 0.3 ;-- labelbar x-position
 lby = 0.9 ;-- labelbar y-position
 lbw = 0.2 ;-- labelbar width
 lbh = 0.8 ;-- labelbar height

;-- labelbar resources
 lbres = True
 lbres@lbAutoManage = False ;-- we want to control the labelbar
 lbres@lbOrientation = "vertical" ;-- labelbar orientation
 lbres@lbLabelFontHeightF = 0.024 ;-- increase label font size
 lbres@lbLabelFontThicknessF = 4. ;-- increase label font thickness
 lbres@lbLabelStride = 1 ;-- label every value
 lbres@lbPerimOn = False ;-- no box around labelbar
 lbres@lbLabelFontColor = "black" ;-- labe font color
 lbres@lbLabelAlignment = "InteriorEdges" ;-- where to draw the labels
 lbres@lbLabelOffsetF = 0.05 ;-- move labels to the right
 lbres@lbMonoFillPattern = mpattern ;-- use same fill pattern as contour plot
 lbres@lbMonoFillColor = False ;-- use multiple colors
 lbres@lbFillColors = cncols ;-- contour colors
 lbres@lbLabelStrings = labels ;-- contour labels

 lbres@vpWidthF = lbw ;-- labelbar viewport width
 lbres@vpHeightF = lbh ;-- labelbar viewport height

 gsn_labelbar_ndc(wksl,nboxes,labels,lbx,lby,lbres) ;-- draw labelbar

;-- text resources labelbar annotations
 txres = True
 txres@txFontHeightF = 0.018 ;-- units text font size

 gsn_text_ndc(wksl, "[C~S~o~N~]", 0.440, 0.12, txres) ;-- add units to labelbar

 print(" - labelbar plot done")

 frame(wksl) ;-- advance labelbar frame

end
EOF

#***********************************************
#-------------------------------------------------------------------
#-- run NCL scripts to generate the input images
#-------------------------------------------------------------------
 if [[ $RUN_NCL == 1 ]] ; then
    rm -rf plot_*.png #-- delete all old plots

    echo "--------------------------------------------"
    echo "** run NCL script"
    ncl -Q -n ${NCL_SCRIPT} #-- run NCL without standard output
 fi

#***********************************************
#-------------------------------------------------------------------
#-- do the tilting of the plot and create the composed plot
#-------------------------------------------------------------------
 if [[ $RUN_COMPOSE == 1 ]] ; then
    echo "--------------------------------------------"
    echo "** run ImageMagick"

    rm -rf compose.jpg #-- delete old composed file

    #-- new width and height of sheared image
    co="plot_contour.png"
    co_width=2800 ; co_height=900
    dxco=50 ; dyco=500
    angle=-40

    #-- labelbar vertical
    lb="plot_labelbar.png"
    lb_width=115 ; lb_height=700
    dxlb=2420 ; dylb=535

    #-- title string
    ti="plot_title.png"
    ti_width=2000 ; ti_height=100
    dxti=400 ; dyti=150

    #-- cut off white space around te plot
    convert -alpha off -background white -density 300 -trim $co tmp_c.png
    convert -alpha off -background white -density 300 -trim $ti tmp_t.png
    convert -alpha off -background white -density 300 -trim $lb tmp_l.png

    echo " - crop white space done"

    #-- original and new coordinate positions of the edges
    xul=0 ; dxul=400
    yul=0 ; dyul=50

    xur=2200 ; dxur=1500
    yur=0 ; dyur=50

    xlr=2200 ; dxlr=1900
    ylr=1200 ; dylr=1200

    xll=0 ; dxll=0
    yll=1200 ; dyll=1200

    #-- do the distortion and write the result to a temporary file
    convert tmp_c.png -matte -virtual-pixel transparent \
            -distort Perspective "$xul,$yul $dxul,$dyul \
             $xur,$yur $dxur,$dyur \
             $xlr,$ylr $dxlr,$dylr \
             $xll,$yll $dxll,$dyll" tmp_contour.png
    echo " - distortion done"

    #-- compose all images a one new image of size 16:9
    convert -size 3000x1688 xc: \
      \( tmp_contour.png -resize ${co_width}x${co_height}! \) -geometry +${dxco}+${dyco} -composite \
      \( tmp_l.png -resize ${lb_width}x${lb_height}! \) -geometry +${dxlb}+${dylb} -composite \
      \( tmp_t.png -resize ${ti_width}x${ti_height}! \) -geometry +${dxti}+${dyti} -composite \
      tmp_compose.jpg

    echo " - composition done"

    #-- resize image to standard 1920x1080 pixel size
    convert -resize 1920x1080 tmp_compose.jpg compose_1_tilted_plot.jpg

    #-- clean up
    rm -rf tmp_*.png tmp_*.jpg
 fi

 echo "--------------------------------------------"

 #***********************************************
 exit
Result: