DKRZ PyNGL contour plot script using xarray#
Example script:
# File:
# rectilinear_contour_xarray.py
#
# Synopsis:
# Demonstrate the use of xarray to read a netCDF file.
# Create a contour plot.
#
# Category:
# xarray
# netCDF
# contour
#
# Author:
# Karin Meier-Fleischer
#
# Date of initial publication:
# January, 2019
#
# Description:
# Demonstrate the use of xarray to read a netCDF file.
# Create a contour plot.
#
# Effects illustrated:
# - Read netCDF file with xarray
# - Create contour plot
#
# Output:
# A single visualization is produced.
#
'''
DKRZ Python Example: rectilinear_contour_xarray.py
- Read netCDF file
- Create contour plot
'''
from __future__ import print_function
import os
import numpy as np
import xarray as xr
import Ngl
#-----------------------------------------------------------------------
#-- Function: add_titles(wks, plot, title, left, center, right, xtitle, ytitle)
#-----------------------------------------------------------------------
def ngl_Strings(wks, plot, title='', left='', center='', right='', xtitle='', ytitle=''):
vpx = Ngl.get_float(plot,'vpXF') #-- retrieve value of res.vpXF from plot
vpy = Ngl.get_float(plot,'vpYF') #-- retrieve value of res.vpYF from plot
vpw = Ngl.get_float(plot,'vpWidthF') #-- retrieve value of res.vpWidthF from plot
vph = Ngl.get_float(plot,'vpHeightF') #-- retrieve value of res.vpHeightF from plot
ymax = vpy+0.08 #-- we need space for the title and strings
if(ymax > 0.98):
print("--> if you can't see the title use res.nglMaximize = False and/or set res.vpYF")
#-- add title
if(title != ''):
tires = Ngl.Resources()
tires.txFontHeightF = 0.016
tires.txJust = 'CenterCenter'
tires.txFont = 22 #-- Font 22: Helvetica bold
if(left != '' or center != '' or right != ''):
y = vpy + 0.075
else:
y = vpy + 0.05
Ngl.text_ndc(wks, title, 0.5, y, tires)
#-- add left, center and/or right string
txres = Ngl.Resources()
txres.txFontHeightF = 0.020 #-- font size for left, center and right string
y = vpy + 0.035 #-- y-position
if(left != ''):
txres.txJust = 'CenterLeft' #-- text justification
x = vpx #-- x-position
Ngl.text_ndc(wks, left, x, y, txres) #-- add text to wks
if(center != ''):
txres.txJust = 'CenterCenter' #-- text justification
Ngl.text_ndc(wks, center, 0.5, y, txres) #-- add text to wks
if(right != ''):
txres.txJust = 'CenterRight' #-- text justification
x = vpx+vpw #-- x-position
Ngl.text_ndc(wks, right, x, y, txres) #-- add text to wks
#-- add y-axis title string
txtires = Ngl.Resources()
txtires.txFontHeightF = 0.024 #-- font size for x-axis title string
txtires.txAngleF = 90.0
txtires.txJust = 'CenterCenter' #-- text justification
y = vpy - vph/2 #-- y-position
x = vpx - 0.12
Ngl.text_ndc(wks, ytitle, x, y, txtires) #-- add text to wks
#-----------------------------------------------------------------------
#-- Function: main
#-----------------------------------------------------------------------
def main():
#-- open file and read variable and time
home = os.environ.get('HOME')
fname = os.path.join(home,'/NCL/PyNGL/User_Guide_examples/rectilinear_grid_2D.nc')
#-- open file and read variables
f = xr.open_dataset(home+fname)
temp = f['tsurf'][0,::-1,:] #-- first time step, reverse latitude
lat = f['lat'][::-1] #-- reverse latitudes
lon = f['lon'][:] #-- all longitudes
if temp.attrs['long_name']:
lname = temp.attrs['long_name'] #-- retrieve variable long_name
if temp.attrs['units']:
units = temp.attrs['units'] #-- retrieve variable units
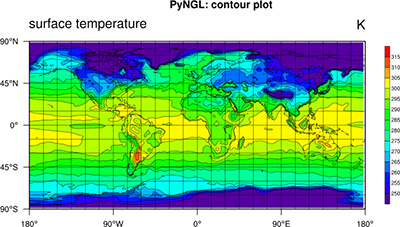
title = 'PyNGL: contour plot' #-- set title string
#-- open a workstation
wkres = Ngl.Resources() #-- generate an res object for workstation
wkres.wkColorMap = 'rainbow' #-- choose colormap
wks = Ngl.open_wks('png','plot_rectilinear_cont_xarray',wkres) #-- open workstation
#-- set resources
res = Ngl.Resources() #-- generate a resource object
res.nglMaximize = False
res.nglPointTickmarksOutward = True #-- point tickmarks outward
res.nglDraw = False
res.nglFrame = False
res.vpXF = 0.1 #-- viewport x-position
res.vpYF = 0.8 #-- viewport y-position
res.vpWidthF = 0.7 #-- viewport width
res.vpHeightF = 0.7 #-- viewport height
res.cnFillOn = True #-- turn on contour fill
res.cnLineLabelsOn = False #-- turn off line labels
res.cnInfoLabelOn = False #-- turn off info label
res.cnLevelSelectionMode = 'ManualLevels' #-- define your own contour levels
res.cnMinLevelValF = 250. #-- minimum contour value
res.cnMaxLevelValF = 315. #-- maximum contour value
res.cnLevelSpacingF = 5. #-- contour increment
res.lbRightMarginF = 0.8 #-- move labelbar to the left
res.sfXArray = lon.values #-- lon as np.ndarray
res.sfYArray = lat.values #-- lat as np.ndarray
#-- create the plot
plot = Ngl.contour_map(wks,temp,res) #-- draw contours over a map
#-- add additional strings to plot (like NCL's gsnLeftString and gsnRightString)
ngl_Strings(wks, plot, title=title, left=lname, right=units, ytitle=lname)
#-- done
Ngl.draw(plot)
Ngl.frame(wks)
Ngl.end()
#-------------------------------------------------------------
#-- run main
#-------------------------------------------------------------
if __name__ == '__main__':
main()
Result: