DKRZ PyNGL example bar chart#
Example:
import numpy as np
import Ngl
#-- function get_bar returns coordinates of a bar
def get_bar(x,y,dx,ymin,bar_width_perc=0.6):
dxp = (dx * bar_width_perc)/2.
xbar = np.array([x-dxp, x+dxp, x+dxp, x-dxp, x-dxp])
ybar = np.array([ ymin, ymin, y, y, ymin])
return xbar,ybar
#-----------------------------------------------------------------------
#-- Function: main
#-----------------------------------------------------------------------
def main():
#-- create random x- and y-values
x = np.arange(1,13,1)
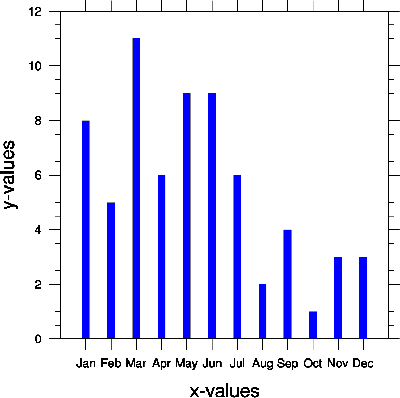
y = [8,5,11,6,9,9,6,2,4,1,3,3]
dx = min(x[1:-1]-x[0:-2]) #-- distance between x-values
#-- define color and x-axis labels
color = 'blue'
xlabels = ["Jan","Feb","Mar","Apr","May","Jun", \
"Jul","Aug","Sep","Oct","Nov","Dec"]#-- x-axis labels
#-- open a workstation
wkres = Ngl.Resources() #-- generate an resources object for workstation
wks_type = "png" #-- output type of workstation
wks = Ngl.open_wks(wks_type,"plot_TRANS_bar_chart_py",wkres)
#-- set resources
res = Ngl.Resources() #-- generate an res object for plot
res.nglFrame = False #-- don't advance frame
res.nglPointTickmarksOutward = True #-- point tickmarks outward
res.tiXAxisString = "x-values" #-- x-axis title
res.tiYAxisString = "y-values" #-- y-axis title
res.tmXBMode = "Explicit" #-- define bottom x-axis values and labels
res.tmXBValues = x #-- x-axis values
res.tmXBLabels = xlabels #-- x-axis labels
res.tmXBLabelFontHeightF = 0.012 #-- bottom x-axis font size
res.trXMinF = 0.0 #-- x-axis min value
res.trXMaxF = 13.0 #-- x-axis max value
res.trYMinF = 0.0 #-- y-axis min value
res.trYMaxF = 12.0 #-- y-axis max value
#-- bar resources
barres = Ngl.Resources() #-- resource list for bars
barres.gsFillColor = color #-- set bar color
#-- loop through each y point and create bar
for i in range(len(y)):
xbar,ybar = get_bar(x[i], y[i], dx, res.trXMinF, 0.3)
plot = Ngl.xy(wks, xbar, ybar, res)
Ngl.polygon(wks, plot, xbar, ybar, barres) #-- filled bar
Ngl.frame(wks) #-- advance frame
Ngl.end()
if __name__ == '__main__':
main()
Result: