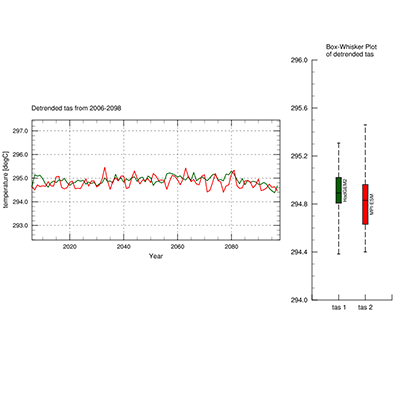
DKRZ PyNGL example Box-Whisker plot#
Software requirements:
Python 2
PyNGL 1.6.1
PyNio 1.5.1
netCDF4
scipy
numpy
Run the map example script:
python boxplot_function.py
Example script:
# File:
#    boxplot_function.py
#
# Synopsis:
#    Read ASCII data and draw countries of global map with colors depending on their values.
#
# Category:
#    xy plot
#    statistics
#    polylines, polygons
#    functions
#    text
#
# Based on DKRZ's NCL example:  test_boxplot_mod_data.ncl
#
# Author:
#    Karin Meier-Fleischer
#
# Date of initial publication:
#    December, 2018
#
# Description:  Create a boxplot plot with modified functions.
#
# This boxplot_mod function is a based on Dennis Shea's NCL boxplot function from
# the shea_util.ncl library.
#
# Added resources to boxOpts:
#    boxWidth         --> change the width of the boxes, default: 1.0
#    fillColorOn      --> turn on/off fill color
#    fillColors       --> array of colors ['green','blue']; default 'gray70'
#    labelPosition    --> set position: 'right' or 'left'
#    boxLabels        --> array of box labels e.g. ["tas 1","tas 2"]
#    LabelFontHeightF --> change the box label font size, default 0.010
#
# Effects illustrated:
#    - Create an xy-plot
#    - compute statistics
#    - Define function boxplot_mod
#    - Create color filled boxplot
#    - Add polylines and polygons
#    - Add text
#
#
# Output:   One visualization is produced.
#
'''
 PyNGL Example:  boxplot_function.py

 - Create an xy-plot
 - Compute statistics
 - Define function boxplot_mod
 - Create color filled boxplot
 - Add polylines and polygons
 - Add text

'''
from __future__ import print_function
import sys, os
import netCDF4
import numpy as np
from scipy import stats,signal
import Ngl,Nio

#---------------------------------------------------------------
# Function boxplot_mod
#
# Create the Box-Whisker plot from the given statistics.
#---------------------------------------------------------------
def boxplot_mod(wks,y,boxOpts,plotres,lineres):

    #-- set box label font size
    if(hasattr(boxOpts,'LabelFontHeightF')):
        textsize = boxOpts.LabelFontHeightF
    else:
    # boxOpts.LabelFontHeightF = 0.010
        textsize = 0.010

    #-- set box labels
    if(hasattr(boxOpts,'boxLabels')):
        x = np.arange(0,len(boxOpts.boxLabels),1)
    else:
        boxOpts.boxLabels = ['default' for x in range(0,y.shape[0])]

    #-- set data array, number of boxes to be drawn and their width
    y = np.array(y)
    numbox = len(boxOpts.boxLabels)
    boxWidths = np.zeros(numbox,dtype='float')

    xAxis = np.arange(0,numbox+2,1) #-- x-axis values
    dx = len(xAxis)/numbox

    labarr = xAxis.astype('str') #-- define x-axis labels
    labarr[0] = ''
    labarr[numbox+1] = ''
    for i in range(0,len(plotres.tmXBLabels)):
       labarr[i+1] = plotres.tmXBLabels[i]

    #-- set box width
    if(boxOpts):
        if(hasattr(boxOpts,'boxWidth')):
            if(len(boxOpts.boxWidth) != 1 and len(boxOpts.boxWidth) != numbox):
                print("boxplot: Number of input box widths must either equal 1 or the number of boxes (%4i). Using first specified box width only." % numbox)
                boxWidths[:] = boxOpts.boxWidth[0]
            else:
                boxWidths = boxOpts.boxWidth
        else:
            boxWidths[:] = dx*.2
    else:
        boxWidths[:] = dx*.2

    #-- create a blank plot
    plotres.trXMinF = xAxis.min()
    plotres.trXMaxF = xAxis.max()
    plotres.tmXBMode = 'Explicit'   #-- set x axis tickmark labels
    plotres.tmXBLabels = list(labarr)
    plotres.tmXBValues = xAxis

    plot = Ngl.blank_plot(wks,plotres)

    #-- set resources for the polylines
    polyres = Ngl.Resources()   #-- set up defaults
    polyres.gsLineColor = 'black'   #-- color of lines
    polyres.gsLineThicknessF = 1.5   #-- thickness of lines
    polyres.gsLineDashPattern = 0

    fsatts = list(lineres.__dict__.keys())   #-- retrieve the resource attributes

    if(lineres):
        for ty in range(0,len(fsatts)):
            elements = getattr(lineres,fsatts[ty])
            setattr(polyres,fsatts[ty],elements)

    if(boxOpts):
        if(not hasattr(boxOpts,'fillColorOn')):
            boxOpts.fillColorOn = False

        if(hasattr(boxOpts,'boxColors')):
            boxcolor = boxOpts.boxColors
            if(len(boxcolor) == 1 or len(boxcolor) != numbox):
                if(len(boxcolor) != numbox):
                    print("boxplot: warning: Number of input colors must either equal 1 or the number of boxes (%2i). Using first specified color only." % numbox)
                polyres.gsLineColor = boxcolor[0]
                cflag = 1
            else:
                cflag = 2
        else:
            cflag = 1
    else:
        cflag = 1

    #-- set label text resources
    textres = Ngl.Resources()
    textres.txFontColor = 'black'   #-- set text color to black
    textres.txFontHeightF = textsize   #-- decrease font size
    textres.txJust = 'CenterCenter'
    textres.txAngleF = 90.   #-- rotate text counterclockwise 90 deg.

    #-- assign graphic array for polylines (outlines); add graphic arrays for filled polygons and labels
    dum = []
    dumf = []
    dumtx = []

    #-- draw filled boxes and label them if turned on
    for im in range(0,numbox):
        ff = xAxis[im+1]
        if (hasattr(boxOpts,'fillColorOn')):
            if(boxOpts.fillColorOn == True):
                if(hasattr(boxOpts,'fillColors')):
                    polyres.gsLineColor = 'black' #-- set to black for the outlines
                    polyres.gsFillColor = boxOpts.fillColors[im]
                    cflag = 1
                else:
                    polyres.gsFillColor = 'gray70' #-- default fill color

                pxl = (ff-(boxWidths[im]/2.))
                pxr = (ff+(boxWidths[im]/2.))
                px = [pxl,pxr,pxr,pxl,pxl]
                py = [y[im,3],y[im,3],y[im,1],y[im,1],y[im,3]]
                dumf.append(Ngl.add_polygon(wks,plot,px,py,polyres))

        if(hasattr(boxOpts,'boxLabels')):
            if(hasattr(boxOpts,'labelPosition')):
                if(boxOpts.labelPosition == 'right'):
                    txx = (ff+(boxWidths[im]/2.)) + (boxWidths[im]/2.) + 0.03
                else:
                    txx = (ff-(boxWidths[im]/2.)) - (boxWidths[im]/2.) - 0.03
            else:
                txx = (ff+(boxWidths[im]/2.)) + (boxWidths[im]/2.) + 0.03 #-- default position 'right'

            label = boxOpts.boxLabels[im]
            txy = y[im,3] - (y[im,3]-y[im,1])/2.
            dumtx.append(Ngl.add_text(wks,plot,label,txx,txy,textres))

    #-- create the polylines for the box-whisker plot
    for gg in range(0,numbox):
        ff = xAxis[gg+1]

        if(cflag == 2):
            polyres.gsLineColor = boxcolor[gg]

        #-- y(n,0) = bottom_value,
        #-- y(n,1) = bottom_value_of_box,
        #-- y(n,2) = mid-value_of_box,
        #-- y(n,3) = top_value_of_box,
        #-- y(n,4) = top_value.

        #-- short top horizontal line
        yy = np.array([y[gg,4],y[gg,4]])
        xx = np.array([(ff-(boxWidths[gg]/4.)),(ff+(boxWidths[gg]/4.))])
        if(not((np.isnan(xx).any() or np.isnan(yy).any()))):
            dum.append(Ngl.add_polyline(wks,plot,xx,yy,polyres))
        #-- upper vertical line
        yy = [y[gg,3],y[gg,4]]
        xx = [ff,ff]
        polyres.gsLineDashPattern = 1
        if(not (np.isnan(xx).any() or np.isnan(yy).any())):
            dum.append(Ngl.add_polyline(wks,plot,xx,yy,polyres))

        #-- upper horizontal box line
        yy = [y[gg,3],y[gg,3]]
        xx = [(ff-(boxWidths[gg]/2.)),(ff+(boxWidths[gg]/2.))]
        polyres.gsLineDashPattern = 0
        if(not (np.isnan(xx).any() or np.isnan(yy).any())):
            dum.append(Ngl.add_polyline(wks,plot,xx,yy,polyres))
        #-- lower horizontal box line
        yy = [y[gg,1],y[gg,3]]
        xx = [(ff-(boxWidths[gg]/2.)),(ff-(boxWidths[gg]/2.))]
        if(not (np.isnan(xx).any() or np.isnan(yy).any())):
            dum.append(Ngl.add_polyline(wks,plot,xx,yy,polyres))
        #-- median line of box
        yy = [y[gg,2],y[gg,2]]
        xx = [(ff-(boxWidths[gg]/2.)),(ff+(boxWidths[gg]/2.))]
        if(not (np.isnan(xx).any() or np.isnan(yy).any())):
            dum.append(Ngl.add_polyline(wks,plot,xx,yy,polyres))
        #-- right vertical line of box
        yy = [y[gg,1],y[gg,3]]
        xx = [(ff+(boxWidths[gg]/2.)),(ff+(boxWidths[gg]/2.))]
        if(not (np.isnan(xx).any() or np.isnan(yy).any())):
            dum.append(Ngl.add_polyline(wks,plot,xx,yy,polyres))
        #-- left vertical line of box
        yy = [y[gg,1],y[gg,1]]
        xx = [(ff-(boxWidths[gg]/2.)),(ff+(boxWidths[gg]/2.))]
        if(not (np.isnan(xx).any() or np.isnan(yy).any())):
            dum.append(Ngl.add_polyline(wks,plot,xx,yy,polyres))

        #-- lower vertical line
        yy = [y[gg,0],y[gg,1]]
        xx = [ff,ff]
        polyres.gsLineDashPattern = 1
        if(not (np.isnan(xx).any() or np.isnan(yy).any())):
            dum.append(Ngl.add_polyline(wks,plot,xx,yy,polyres))
        #-- lower horizontal line
        yy = [y[gg,0],y[gg,0]]
        xx = [(ff-(boxWidths[gg]/4.)),(ff+(boxWidths[gg]/4.))]
        polyres.gsLineDashPattern = 0
        if(not (np.isnan(xx).any() or np.isnan(yy).any())):
            dum.append(Ngl.add_polyline(wks,plot,xx,yy,polyres))

    return(plot)

#-----------------------------------------------------------------------
#-- Function: main
#-----------------------------------------------------------------------
def main():
    #-- data path and file names
    home = os.environ.get('HOME')
    fname1 = home + '/data/CORDEX/tas_AFR-44_HadGEM2-ES_rcp45_r1i1p1_CCLM_4-8-17_ym_20060101-20981231-tser.nc'
    fname2 = home + '/data/CORDEX/tas_AFR-44_MPI-ESM-LR_rcp45_r1i1p1_CCLM_4-8-17_ym_20060101-20981231-tser.nc'

    #-- open files
    f1 = Nio.open_file(fname1,"r") #-- open data file
    f2 = Nio.open_file(fname2,"r") #-- open data file

    #-- read time and convert to UTC date
    t = f1.variables['time']
    attrs = t.attributes
    units = attrs['units']
    calendar = attrs['calendar']
    utc_date = netCDF4.num2date(t, units, calendar)

    year = [date.year for date in utc_date]
    month = [date.month for date in utc_date]
    day = [date.day for date in utc_date]
    hour = [date.hour for date in utc_date]
    minute = [date.minute for date in utc_date]
    year = np.array(year)
    tmin = min(year)
    tmax = max(year)

    #-- select variables of timesteps
    t_ind = Ngl.ind(year >= tmin)
    nyear = len(t_ind)
    ntimes = np.arange(0,nyear-1,1)
    tas1 = f1.variables['tas'][t_ind[0]:t_ind[-1],0,0,0]
    tas2 = f2.variables['tas'][t_ind[0]:t_ind[-1],0,0,0]

    #-- detrend data
    slope1,intercept1,r_value1,p_value1,std_err1 = stats.linregress(ntimes,tas1)
    trend1 = intercept1 + (slope1*ntimes)
    detrended1 = signal.detrend(tas1) + intercept1

    slope2,intercept2,r_value2,p_value2,std_err2 = stats.linregress(ntimes,tas2)
    trend2 = intercept2 + (slope2*ntimes)
    detrended2 = signal.detrend(tas2) + intercept2

    #-- assign array to hold the basic statistics list for Box-Whisker plot
    #-- yb(n,0)=bottom_value,
    #-- yb(n,1)=bottom_value_of_box,
    #-- yb(n,2)=mid-value_of_box,
    #-- yb(n,3)=top_value_of_box,
    #-- yb(n,4)=top_value.
    yb = np.ndarray([2,5],dtype='float')

    #-- retrieve statistics data for first variable
    yb[0,0] = np.amin(detrended1) #-- min
    yb[0,1] = np.percentile(detrended1, 25) #-- low percentile (25%)
    yb[0,2] = np.median(detrended1) #-- median
    yb[0,3] = np.percentile(detrended1, 75) #-- high percentile (75%)
    yb[0,4] = np.amax(detrended1) #-- max

    #-- retrieve statistics data for second variable
    yb[1,0] = np.amin(detrended2) #-- min
    yb[1,1] = np.percentile(detrended2, 25) #-- low percentile (25%)
    yb[1,2] = np.median(detrended2) #-- median
    yb[1,3] = np.percentile(detrended2, 75) #-- high percentile (75%)
    yb[1,4] = np.amax(detrended2) #-- max

    #-- open graphic output
    wks = Ngl.open_wks('png','plot_boxplot_mod')

    #-- font size of titles and axis labels
    font_size = 0.012

    #-- timeseries resources - xy-plot
    res = Ngl.Resources()
    res.nglDraw = False #-- don't draw plot
    res.nglFrame = False #-- don't advance the frame
    res.nglMaximize = False #-- don't maximize the plot

    res.vpXF = 0.08 #-- set plot x-position
    res.vpYF = 0.70 #-- set plot y-position
    res.vpWidthF = 0.62 #-- set plot width
    res.vpHeightF = 0.30 #-- set plot height

    res.tiXAxisString = "Year" #-- x-axis titles
    res.tiYAxisString = "temperature [degC]"#-- y-axis titles
    res.tiXAxisFontHeightF = font_size
    res.tiYAxisFontHeightF = font_size

    res.tmXBLabelFontHeightF = font_size
    res.tmYLLabelFontHeightF = font_size - 0.002

    res.tmXMajorGrid = True #-- draw x-grid lines
    res.tmXMajorGridThicknessF = 1.0
    res.tmXMajorGridLineDashPattern = 2

    res.tmYMajorGrid = True #-- draw y-grid lines
    res.tmYMajorGridThicknessF = 1.0
    res.tmYMajorGridLineDashPattern = 2

    res.trXMinF = tmin #-- x-axis minimum
    res.trXMaxF = tmax #-- x-axis maximum

    res.trYMinF = min(min(detrended1),min(detrended2))-2 #-- x-axis minimum
    res.trYMaxF = max(max(detrended1),max(detrended2))+2 #-- y-axis maximum

    res.xyLineThicknessF = 3.0 #-- line width
    res.xyDashPattern = 0 #-- 0: solid line

    #-------------------------------------------------------------------
    #-- left plot: detrended time series
    #-------------------------------------------------------------------
    res.xyLineColor = "darkgreen"
    plot0 = Ngl.xy(wks, year[t_ind[0]:t_ind[-1]], detrended1, res) #-- variable 1

    res.xyLineColor = "red"
    plot00 = Ngl.xy(wks, year[t_ind[0]:t_ind[-1]], detrended2, res) #-- variable 2

    #-- overlay plot00 on plot0 and draw plot0
    Ngl.overlay(plot0,plot00)
    Ngl.draw(plot0)

    #-------------------------------------------------------------------
    #-- right plot: Box-Whisker plot
    #-------------------------------------------------------------------
    vpx = Ngl.get_float(plot0,"vpXF") #-- retrieve plot x-position
    vpy = Ngl.get_float(plot0,"vpYF") #-- retrieve plot y-position
    vpw = Ngl.get_float(plot0,"vpWidthF") #-- retrieve plot width
    vph = Ngl.get_float(plot0,"vpHeightF") #-- retrieve plot height

    #-- resources for the second plot
    resBW = Ngl.Resources()
    resBW.vpXF = vpx+vpw+0.08 #-- set plot position
    resBW.vpWidthF = 0.2 #-- set plot width
    resBW.vpHeightF = 0.6 #-- set plot height
    resBW.vpYF = vpy-(vph/2)+(resBW.vpHeightF/2) #-- set plot position

    resBW.trYMinF = np.floor(yb.min()) #-- y-axis minimum value
    resBW.trYMaxF = np.ceil(yb.max()) #-- y-axis maximum value

    resBW.tmXTOn = False #-- don't draw top x-axis
    resBW.tmXTBorderOn = False
    resBW.tmYROn = False #-- don't draw right y-axis
    resBW.tmYRBorderOn = False

    resBW.tiMainString = "Box-Whisker Plot ~C~of detrended tas"
    resBW.tiMainFontHeightF = font_size

    resBW.tmXBLabels = ["tas 1","tas 2"] #-- set labels for boxes

    resBW.tmXBLabelFontHeightF = font_size
    resBW.tmYLLabelFontHeightF = font_size

    #-- line resources
    lresBW = Ngl.Resources()
    lresBW.gsLineThicknessF = 2.5 #-- polyline width

    #-- special resources for the Box-Whisker plot
    OptBW = Ngl.Resources()
    OptBW.fillColorOn = True #-- turn fill color on, default False
    OptBW.boxLabels = ["HadGEM2","MPI-ESM"] #-- set box labels, default 'default'
    OptBW.fillColors = ["darkgreen","red"] #-- set fill colors, default gray70
    OptBW.boxWidth = [.2,.2] #-- set box width, default 1.0
    OptBW.labelPosition = "right" #-- label position "right" or "left", default right
    OptBW.LabelFontHeightF = 0.009 #-- box label font size, default 0.01

    #-- create the right plot
    plot1 = boxplot_mod(wks, yb, OptBW, resBW, lresBW)

    #-- draw plot1 and advance the frame
    Ngl.draw(plot1)

    #-- write title to right plot
    txres = Ngl.Resources()
    txres.txJust = 'CenterLeft'
    txres.txFontHeightF = font_size

    Ngl.text_ndc(wks,"Detrended tas from "+str(tmin)+"-"+str(tmax),vpx,vpy +0.03,txres)

    #-- advance the frame
    Ngl.frame(wks)

if __name__ == '__main__':
    main()
Result: